Math
Sub Category

SUSCRIBETE AQUÍ: https://bit.ly/3B8CNXP
Suscríbete ► http://bit.ly/SuscribeteElReinoInfantil
Síguenos/Follow us:
Facebook ► https://www.facebook.com/ElReinoInfantil
Instagram► https://www.instagram.com/reino_infantil/
Twitter ► https://twitter.com/Reino_Infantil
¡Encuentra todos nuestros productos exclusivos aquí!
►http://bit.ly/ElReinoInfantilWEB
Título original: Una cuncuna amarilla
Autor: Corcuera Gandarillas, María de la Luz - Rene Norman Albarado Ilic Muñoz
Intérprete: Dúo Tiempo de Sol

SUSCRIBETE AQUÍ: https://bit.ly/3B8CNXP
Suscríbete ► http://bit.ly/SuscribeteElReinoInfantil
Síguenos/Follow us:
Facebook ► https://www.facebook.com/ElReinoInfantil
Instagram► https://www.instagram.com/reino_infantil/
Twitter ► https://twitter.com/Reino_Infantil
¿Quieres más videos? ¡Escucha esta divertida playlist de La Granja de Zenón!
►http://bit.ly/PlaylistCancionesLaGranjaDeZenon
¡Encuentra todos nuestros productos exclusivos aquí!
►http://bit.ly/ElReinoInfantilWEB
La Farolera (Versión 2018) - Rondas y Clásicos Infantiles | El Reino Infantil
(Motivo Popular)
Gonzalo y Clarita
SUSCRIBETE AQUÍ: https://bit.ly/3B8CNXP
¡ATENCIÓN LATINOAMÉRICA!
Ya pueden encontrar nuestro propio canal de El Reino Infantil en Pluto TV.
Encuentra tus videos favoritos AQUÍ: http://bit.ly/PlutoTVERI
¡Prepárate para cantar, aprender, bailar y divertirte!
¡No te lo pierdas!
Letra
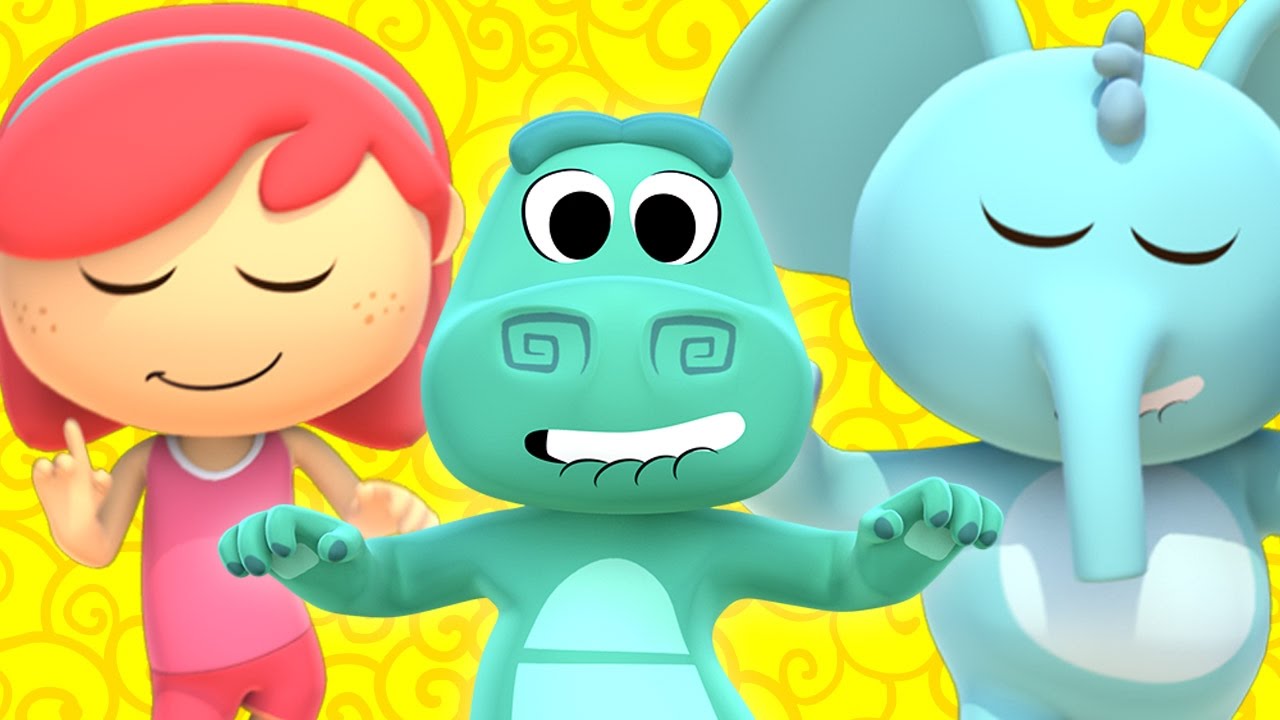
A ver, ver, en este baile
El cocodrilo camina hacia adelante,
el elefante camina hacia atrás,
el pollito camina hacia el costado
y yo en mi bicicleta,
voy para el otro lado.
El cocodrilo Dante
camina hacia adelante,
el elefante Blas
camina hacia atrás,
el pingüino Lalo
camina hacia el costado
y yo en mi bicicleta,
voy para el otro lado.
El cocodrilo Dante
camina hacia adelante,
el elefante Blas
camina hacia atrás,
el pingüino Lalo
camina hacia el costado
y yo en mi bicicleta,
voy para el otro lado.
Y ahora lo vamos a hacer saltando en un pie...
El cocodrilo Dante
camina hacia adelante,
el elefante Blas
camina hacia atrás,
el pingüino Lalo
camina hacia el costado
y yo en mi bicicleta,
voy para el otro lado.
Y ahora lo vamos a hacer agachaditos ......
El cocodrilo Dante
camina hacia adelante,
el elefante Blas
camina hacia atrás,
el pingüino Lalo
camina hacia el costado
y yo en mi bicicleta,
voy para el otro lado.
Y ahora sacudiendo mucho el cuerpito ......
El cocodrilo Dante
camina hacia adelante,
el elefante Blas
camina hacia atrás,
el pingüino Lalo
camina hacia el costado
y yo en mi bicicleta,
voy para el otro lado.
y ahora saltar con los dos pies …...
El cocodrilo Dante
camina hacia adelante,
el elefante Blas
camina hacia atrás,
el pingüino Lalo
camina hacia el costado
y yo en mi bicicleta,
voy para el otro lado.
Y ahora los movimientos muy exagerados......
¡Vamos!
El cocodrilo Dante
camina hacia adelante,
el elefante Blas
camina hacia atrás,
el pingüino Lalo
camina hacia el costado
y yo en mi bicicleta,
voy para el otro lado.
¡Más rápido!
El cocodrilo Dante
camina hacia adelante,
el elefante Blas
camina hacia atrás,
el pingüino Lalo
camina hacia el costado
y yo en mi bicicleta,
voy para el otro lado.
Y todos aplaudiendo el baile ha terminado
Y todos aplaudiendo el baile ha terminado
Suscríbete ► http://bit.ly/SuscribeteElReinoInfantil
Síguenos/Follow us:
Facebook ► https://www.facebook.com/ElReinoInfantil
Instagram► https://www.instagram.com/reino_infantil/
Twitter ► https://twitter.com/Reino_Infantil
¡Encuentra todos nuestros productos exclusivos aquí!
►http://bit.ly/ElReinoInfantilWEB
El Baile de los Animales - Las Canciones del Zoo 3 | El Reino Infantil
Para colaborar con todas las familias que deben quedarse en sus hogares debido a la situación mundial actual, llegó la App de Juegos de canciones del Zoo, especial para los más pequeños de la casa. Podrán acceder a todos los juegos de forma gratuita. Sin necesidad de Wifi ni Internet.
Resuelve rompecabezas, aprende los números, descubre los colores y conoce las formas a través de fascinantes y divertidos mini juegos animados.
Disponible para sistema operativo Android a través de este link:
http://bit.ly/App-JuegosDeZoo-Android
¡Próximamente disponible también en sistema IOS!
Título: El Baile de los animales
Autores: Marceillac, Eduardo Alberto - Rogier, Cecilia María Teresa
Intérprete: Dúo Tiempo de Sol
SUSCRIBETE AQUÍ: https://bit.ly/3B8CNXP
Suscríbete ► http://bit.ly/SuscribeteElReinoInfantil
Síguenos/Follow us:
Facebook ► https://www.facebook.com/ElReinoInfantil
Instagram► https://www.instagram.com/reino_infantil/
Twitter ► https://twitter.com/Reino_Infantil
¿Quieres más videos? ¡Escucha esta divertida playlist de Bichikids!
►http://bit.ly/Bichikids
¡Encuentra todos nuestros productos exclusivos aquí!
►http://bit.ly/ElReinoInfantilWEB
Súbete al Tren de la Alegría - Bichikids 2 | El Reino Infantil
Intérprete: Dúo Tiempo de Sol
SUSCRIBETE AQUÍ: https://bit.ly/3B8CNXP
🎁 En estas Navidades, encuentra los productos de La Granja de Zenón en Amazon Store 🎁
Peluches ▶️ https://rebrand.ly/AmazonMXPeluchesMusicalesLGDZ
Sábanas y Mantas ▶️ https://rebrand.ly/AmazonMXJuegoDeCamaLDGZ
🛜 Las Aventuras de Bartolito en Internet https://www.youtube.com/playli....st?list=PL2KQv6-I8Mw
Letra
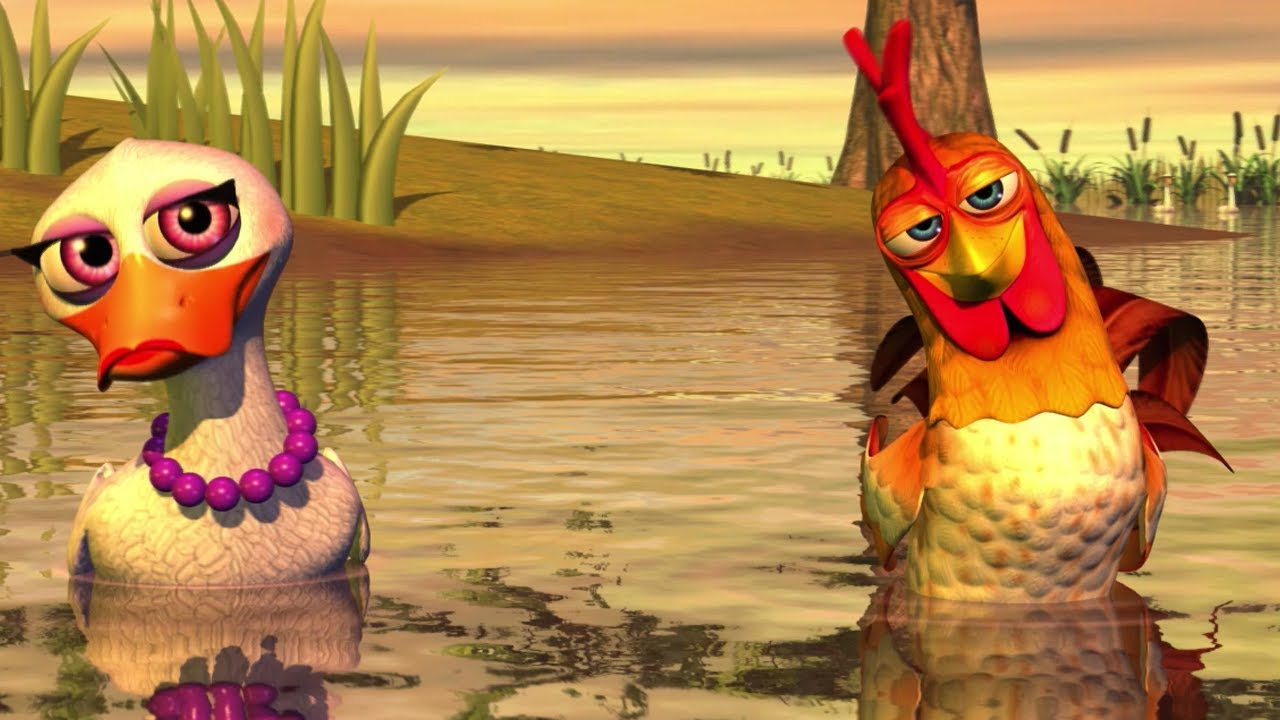
Un gallo se enamoró perdidamente
de una pata que nadaba en la laguna
y ese gallo que era muy inteligente
a la pata le cantaba con la luna.
Pero el pato que se había puesto celoso
se coló por el corral de las gallinas
y decía "este pato me las paga"
y con todas las gallinas solito se quedó.
El gallo aprendió a nadar
y la pata a cacarear
El gallo aprendió a nadar
y la pata a cacarear
Lara lararaila ♫
Cuack cuack ♫
Lara lararaila ♫
Cuack cuack ♫
Lara lararaila ♫
Cuack cuack ♫
Lara lararaila ♫
Cuack cuack ♫
Un gallo se enamoró perdidamente
de una pata que nadaba en la laguna
y ese gallo que era muy inteligente
a la pata le cantaba con la luna.
Pero el pato que se había puesto celoso
se coló por el corral de las gallinas
y decía "este pato me las paga"
y con todas las gallinas solito se quedó.
El gallo aprendió a nadar
y la pata a cacarear.
El gallo aprendió a nadar
y la pata a cacarear.
Lara lararaila ♫
Cuack cuack ♫
Lara lararaila ♫
Cuack cuack ♫
Lara lararaila ♫
Cuack cuack ♫
Lara lararaila ♫
Cuack cuack ♫
Lara lararaila
Cuack cuack... ♫
Suscríbete ► http://bit.ly/SuscribeteElReinoInfantil
Síguenos/Follow us:
Facebook ► https://www.facebook.com/ElReinoInfantil
Instagram► https://www.instagram.com/reino_infantil/
Twitter ► https://twitter.com/Reino_Infantil
¡Encuentra todos nuestros productos exclusivos aquí!
►http://bit.ly/ElReinoInfantilWEB
El Gallo y la Pata - Canciones de la Granja de Zenón 2
Título original: El Gallo y la Pata
Autor/Compositor: Osorio López, Henry - Anderle Petri, Oscar
Intérprete: Riki Maravilla

SUSCRIBETE AQUÍ: https://bit.ly/3B8CNXP
Letra
Roco el hurón no está de humor,
tiene sueño y quiere descansar
mañana temprano tiene que madrugar
y sus amigos solo quieren festejar.
El león, la cebra, el tigre, la pantera
y la jirafa acaban de llegar.
Ellos quieren bailar la noche entera,
pobre Roco lo van a despertar.
Y bailan chachachá y bailan agogo
bailan tango, twist y rock and roll,
Mambo, break dance, la salsa y la rumba
bailan todos menos Roco el hurón.
Bailan chachachá y bailan agogo
bailan tango, twist y rock and roll,
Mambo, break dance, la salsa y la rumba
bailan todos menos Roco el hurón.
Roco está molesto no puede dormir
quieren que el baile llegue a su fin,
Pero el rinoceronte y el canguro
están felices y no se quieren ir.
Y bailan chachachá y bailan agogo
bailan tango, twist y rock and roll,
Mambo, break dance, la salsa y la rumba
bailan todos menos Roco el hurón.
Bailan chachachá y bailan agogo
bailan tango, twist y rock and roll,
Mambo, break dance, la salsa y la rumba
bailan todos menos Roco el hurón.
Baila Roco baila Roco baila Roco baila
Baila Roco baila Roco baila Roco baila
Baila Roco baila Roco baila Roco baila
Baila Roco baila Roco baila Roco baila
Baila che, baila Harlem shake,
baila polka, swing y merengue también,
Luego baila che, baila Harlem shake,
baila polka, swing y merengue también.
Y bailan chachachá y bailan agogo
bailan tango, twist y rock and roll,
Mambo, break dance, la salsa y la rumba
bailan todos junto a Roco el huron.
Bailan chachachá y bailan agogo
bailan tango, twist y rock and roll,
Mambo, break dance, la salsa y la rumba
bailan todos junto a Roco el huron,
bailan todos junto a Roco el huron.
Suscríbete ► http://bit.ly/SuscribeteElReinoInfantil
Síguenos/Follow us:
Facebook ► https://www.facebook.com/ElReinoInfantil
Instagram► https://www.instagram.com/reino_infantil/
Twitter ► https://twitter.com/Reino_Infantil
¡Encuentra todos nuestros productos exclusivos aquí!
►http://bit.ly/ElReinoInfantilWEB
Roco El Hurón - Las Canciones del Zoo 2 | El Reino Infantil
Título: Roco el Hurón
Autor/Compositor: (Torres, Macarena)
Intérprete: Carrisongs

SUSCRIBETE AQUÍ: https://bit.ly/3B8CNXP
Suscríbete ► http://bit.ly/SuscribeteElReinoInfantil
Síguenos/Follow us:
Facebook ► https://www.facebook.com/ElReinoInfantil
Instagram► https://www.instagram.com/reino_infantil/
Twitter ► https://twitter.com/Reino_Infantil
¿Quieres más videos? ¡Mira esta divertida playlist de La Granja de Zenón!
►http://bit.ly/PlaylistCancionesLaGranjaDeZenon
¡Encuentra todos nuestros productos exclusivos aquí!
►http://bit.ly/ElReinoInfantilWEB
Cantan Los Animales - La Granja de Zenón 4 | El Reino Infantil
(Miranda, María Ines - López, Atilio Rubén)
Luján
SUSCRIBETE AQUÍ: https://bit.ly/3B8CNXP
Suscríbete ► http://bit.ly/SuscribeteElReinoInfantil
Síguenos/Follow us:
Facebook ► https://www.facebook.com/ElReinoInfantil
Instagram► https://www.instagram.com/reino_infantil/
Twitter ► https://twitter.com/Reino_Infantil
¡Encuentra todos nuestros productos exclusivos aquí!
►http://bit.ly/ElReinoInfantilWEB
El Baile del Hokey Pokey - Bichikids | El Reino Infantil
Título original: El Baile del Hokey Pokey
Autor: (Motivo Popular)
Interprete: Lalu Miranda

SUSCRIBETE AQUÍ: https://bit.ly/3B8CNXP
Suscríbete ► http://bit.ly/SuscribeteElReinoInfantil
► Síguenos en Facebook: https://rebrand.ly/FacebookERI
► Síguenos en Instagram: https://rebrand.ly/InstaERI
¡Encuentra todos nuestros productos exclusivos aquí!
►http://bit.ly/ElReinoInfantilWEB
Se acerca la navidad. El burrito ve una hermosa estrella en el Cielo que indica el camino hacia el pueblo. Zenón, sus sobrinos y los animales de la Granja harán una peregrinación para visitar el hermoso pesebre gigante que se ha montado en la plaza principal para celebrar la Navidad.
Letra
Mi burrito sabanero
Con mi burrito sabanero
Voy camino de Belén,
Con mi burrito sabanero
Voy camino de Belén.
Si me ven si me ven
Voy camino de Belén. (bis)
El lucerito mañanero
Ilumina mi sendero. (bis)
Si me ven si me ven
Voy camino de Belén (bis)
Con mi cuatrico voy cantando,
Mi burrito va trotando,
Con mi cuatrico voy cantando
Mi burrito va trotando.
Si me ven si me ven
Voy camino de Belén. (bis)
Tuki tuki tuki tuki,
tuki tuki tuki ta
Apúrate mi burrito
que ya vamos a llegar.
Tuki tuki tuki tuki,
tuki tuki tuki tu
Apúrate mi burrito
vamos a ver a Jesús
Con mi burrito sabanero
Voy camino de Belén,
Con mi burrito sabanero
Voy camino de Belén.
Si me ven si me ven
Voy camino de Belén. (bis)
El lucerito mañanero
Ilumina mi sendero. (bis)
Si me ven si me ven
Voy camino de Belén. (bis)
Con mi cuatrico voy cantando,
Mi burrito va trotando,
Con mi cuatrico voy cantando
Mi burrito va trotando.
Si me ven si me ven
Voy camino de Belén. (bis)
Tuki tuki tuki tuki,
tuki tuki tuki ta
Apúrate mi burrito
que ya vamos a llegar.
Tuki tuki tuki tuki,
tuki tuki tuki tu
Apúrate mi burrito
vamos a ver a Jesús.
Con mi burrito sabanero
Voy camino de Belén,
Con mi burrito sabanero
Voy camino de Belén.
Si me ven si me ven
Voy camino de Belén. (bis)
Si me ven si me ven
Voy camino de Belén. (bis)
Título original: Mi Burrito Sabanero
Autor: ( Blanco Manzo Hugo Cesar "Hugo Blanco")
Interprete: Sofy Schiaffino

SUSCRIBETE AQUÍ: https://bit.ly/3B8CNXP
Suscríbete ► http://bit.ly/SuscribeteElReinoInfantil
Letra
La Potranca Margarita a la granja hoy llego
con su cola bien peinada y su piel brillando al sol
Los caballos de reojo cuando la miran pasar
admirando su belleza, no hacen más que preguntar:
¿Quién será? La Potranca Margarita
¿Dónde va? A pasear por el jardín
Ella es la potranca más bonita
Y sin mas ni más, la siguen detrás,
todos juntos a pasear
La Potranca Margarita es hermosa como el sol
tiene largas las pestañas se parece a una flor
Los caballos de la granja cuando la miran pasar
se ponen colorados y vuelven a preguntar:
¿Quién será? La Potranca Margarita
¿Dónde va? A pasear por el jardín
Ella es la potranca más bonita
Y sin mas ni más, la siguen detrás,
todos juntos a pasear
Y sin mas ni más, la siguen detrás,
todos juntos a pasear
Síguenos/Follow us:
Facebook ► https://www.facebook.com/ElReinoInfantil
Instagram► https://www.instagram.com/reino_infantil/
Twitter ► https://twitter.com/Reino_Infantil
¡Encuentra todos nuestros productos exclusivos aquí!
►http://bit.ly/ElReinoInfantilWEB
Título Original: La Potranca Margarita
Autor/Compositor: Marceillac, Eduardo Alberto - Rogier, Cecilia María Teresa
Intérprete: Dúo Tiempo de Sol

SUSCRIBETE AQUÍ: https://bit.ly/3B8CNXP
Letra
El oso goloso quiere comer miel
Y las abejitas se enojan con él
El oso goloso quiere comer miel
Y las abejitas se enojan con él.
Las pobres abejitas vuelan de flor en flor
Recolectando néctar con todo su amor
Lo llevan volando hasta su panal
En miel lo convierte, es todo artesanal
El oso goloso quiere comer miel
Y las abejitas se enojan con él
El oso goloso quiere comer miel
Y las abejitas se enojan con él.
El oso goloso quiere comer miel
Y las abejitas se enojan con él
El oso goloso quiere comer miel
Y las abejitas se enojan con él.
El oso goloso les viene a quitar
La miel que le gusta, les quiere robar.
Y las abejitas se empiezan a enojar
Y al oso goloso comienzan a picar.
El oso goloso quiere comer miel
Y las abejitas se enojan con él
El oso goloso quiere comer miel
Y las abejitas se enojan con él.
Todo lo que no es tuyo
No lo tienes que tocar
Aunque te guste mucho
Lo tenés que respetar.
Suscríbete ► http://bit.ly/SuscribeteElReinoInfantil
Síguenos/Follow us:
Facebook ► https://www.facebook.com/ElReinoInfantil
Instagram► https://www.instagram.com/reino_infantil/
Twitter ► https://twitter.com/Reino_Infantil
¿Quieres más videos? ¡Escucha esta divertida playlist de Las Canciones del Zoo!
►http://bit.ly/PlaylistCancionesZOO
¡Encuentra todos nuestros productos exclusivos aquí!
►http://bit.ly/ElReinoInfantilWEB
El Oso Goloso - Las Canciones del Zoo 4 | El Reino Infantil
Título: El Oso Goloso
Autor/Compositor: (Darío, Antonio)
Intérprete: Riki Maravilla

SUSCRIBETE AQUÍ: https://bit.ly/3B8CNXP
#halloween #elreinoinfantil #cancionesinfantiles
Letra:
Fun fu ru fun fun
Fun fu ru fun fun
Buuu
Aaahh
Fun fu ru fun fun
Fun fu ru fun fun
Buuu
Aaahh
El elefante hoy se disfrazó,
con un traje que le dio el hurón.
"Nadie se espante",
dijo el León
Y gritó: "¡socorro!",
cuando vio un ratón.
Porque es noche de brujas
noche de brujas
Buuu
Aaahh
Noche de brujas
Noche de brujas
Buuu
Aaahhh
"¿Dulce o travesura?"
vamos a pedir
casa por casa
para compartir
Hoy la jirafa nos asustó
en una calabaza su cabeza se atoró
"Nadie se espante",
dijo el León
Y gritó: "¡socorro!",
cuando vio un ratón
Porque es noche de brujas
noche de brujas
Buuu
Aaahh
Noche de brujas
Noche de brujas
Buuu
Aaahhh
"¿Dulce o travesura?"
vamos a pedir
casa por casa
para compartir
Porque es noche de brujas
noche de brujas
Buuu
Aaahh
¡Feliz Halloween!
Suscríbete ► http://bit.ly/SuscribeteElReinoInfantil
Síguenos/Follow us:
Facebook ► https://www.facebook.com/ElReinoInfantil
Instagram► https://www.instagram.com/reino_infantil/
Twitter ► https://twitter.com/Reino_Infantil
¿Quieres más videos? ¡Escucha esta divertida playlist de Halloween
►http://bit.ly/videoshalloween
¡Encuentra todos nuestros productos exclusivos aquí!
►http://bit.ly/ElReinoInfantilWEB
Noche de Brujas - Halloween con Canciones del Zoo | El Reino Infantil
Título original: Noche de Brujas
Autor: (Farré, Juan Manuel Seudonimo: Juan Farré)
Interprete: Juan Farré

SUSCRIBETE AQUÍ: https://bit.ly/3B8CNXP
Suscríbete ► http://bit.ly/SuscribeteElReinoInfantil
Síguenos/Follow us:
Facebook ► https://www.facebook.com/ElReinoInfantil
Instagram► https://www.instagram.com/reino_infantil/
Twitter ► https://twitter.com/Reino_Infantil
¿Quieres más videos? ¡Mira esta divertida playlist de La Granja de Zenón!
►http://bit.ly/PlaylistCancionesLaGranjaDeZenon
¡Encuentra todos nuestros productos exclusivos aquí!
►http://bit.ly/ElReinoInfantilWEB
Cierta Vez Yo Escuché - La Granja de Zenón 4 | El Reino Infantil
#Granja #ElReinoInfantil #Floss
¿Aún no conoces el nuevo video de la vaquita más querida de La Granja de Zenón?
Mira “La Vaca Lola Acumulativa” AQUÍ: https://bit.ly/VacaLolaRemix
Además, ya puedes usar los filtros de La Vaca Lola en Facebook y en Instagram. Haz click en estos links:
Facebook: https://bit.ly/FiltroLolaFB
Instagram, según tu dispositivo:
https://bit.ly/FiltroLolaInstaLite
https://bit.ly/FiltroLolaInstagram
Título original: Cierta Vez Yo Escuché
Autor/Compositor: Cecilia Maria Teresa Rogier "Cecilia Rogier" - Eduardo Alberto Marceillac "Chacho Marceillac"
Intérprete: Duo Tiempo de Sol

SUSCRIBETE AQUÍ: https://bit.ly/3B8CNXP
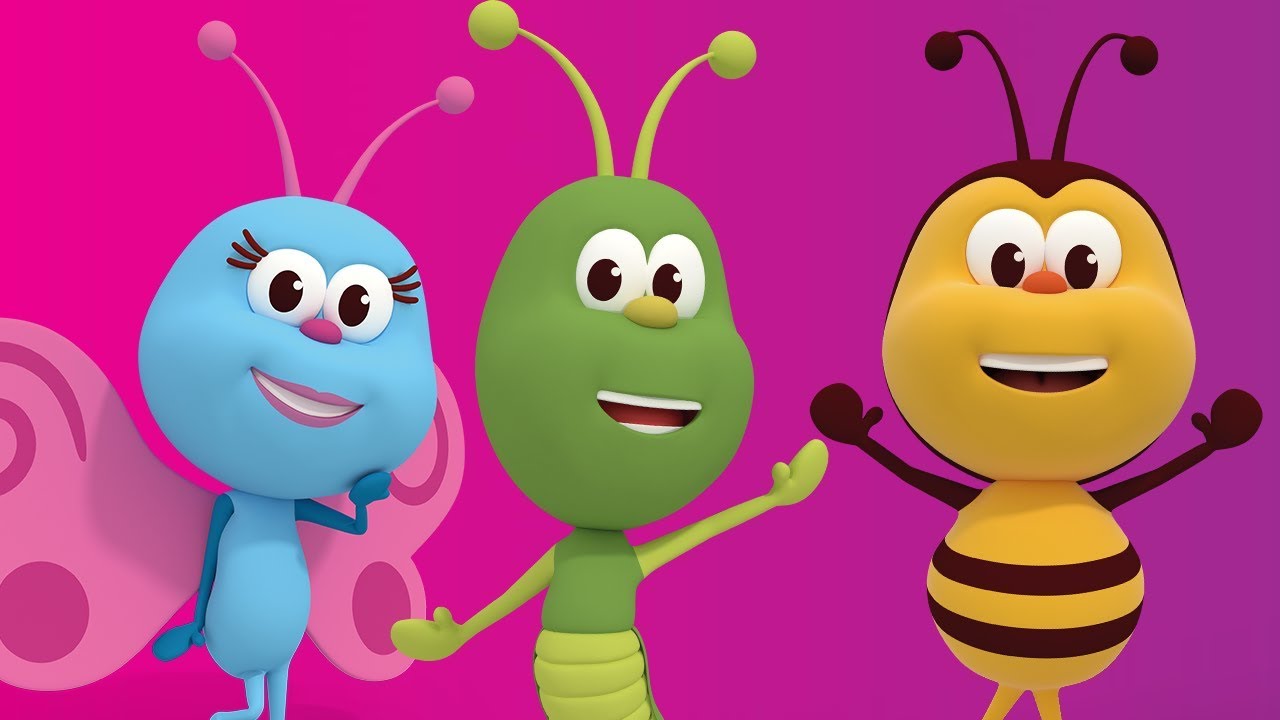
¡A cantar y bailar con los Bichikids! Es hora de divertirse en familia con los bichitos mas lindos al ritmo de esta clásica canción infantil.
Suscríbete ► http://bit.ly/SuscribeteElReinoInfantil
Síguenos/Follow us:
Facebook ► https://www.facebook.com/ElReinoInfantil
Instagram► https://www.instagram.com/reino_infantil/
Twitter ► https://twitter.com/Reino_Infantil
¡Encuentra todos nuestros productos exclusivos aquí!
►http://bit.ly/ElReinoInfantilWEB
Título original: Si Usted Tiene Muchas Ganas De Aplaudir
Autor: (Motivo Popular)
Intérprete: Dúo Tiempo de Sol

SUSCRIBETE AQUÍ: https://www.youtube.com/@ElRei....noInfantil?sub_confi
Los animales de la granja de Zenón recorren caminos de colores en busca de un gran tesoro que se esconde al final del arcoíris. ¿Qué encontrarán allí?
🎉¡Bienvenido a El Reino Infantil en Español! Activa la campanita y suscríbete a nuestro canal de YouTube para no perderte ningún vídeo - https://rebrand.ly/SuscribeteERI
#ElReinoInfantil #LaGranjaDeZenonARodar #ARodar
Más contenido y diversión en nuestras redes sociales:
🤩🎶TikTok - https://rebrand.ly/TikTokERI
😍📸Instagram - https://rebrand.ly/InstaERI
😂👨👩👧👦Facebook - https://rebrand.ly/FacebookERI
🥳🌟El Reino Infantil - https://www.elreinoinfantil.com/
Vídeos que no te puedes perder:
🌟¡LO MEJOR de El Reino Infantil!🌟 - https://rebrand.ly/El-Reino-Infantil
🎇¡NUEVOS EPISODIOS de La Granja de Zenón! 🎇 El Reino Infantil - https://rebrand.ly/Episodios-LaGranjaDeZenon
👨🏼🌾 LA GRANJA DE ZENÓN 👨🏼🌾 TEMPORADA 2 de la SERIE 🌹 El Reino Infantil - https://rebrand.ly/LaGranjaDeZenon-Temporada-2
🎵 LA GRANJA DE ZENÓN 5 🐮 EL REINO INFANTIL - https://rebrand.ly/LaGranjaDeZenon-Canciones-5
¡Canciones, episodios, mix y mucha diversión! El Reino Infantil es el canal donde los más pequeños podrán disfrutar, bailar, cantar y aprender con las series y contenidos más increíbles. ¡Empieza tu aventura en El Reino Infantil donde los sueños nunca tienen fin! Dale like, suscríbete y activa la campanita para no perderte ninguno de nuestros vídeos.
🚗 ¡A encender los motores! ¡Zenón y los animales de la granja salen a recorrer el mundo en sus increíbles autos! Prepárense para viajar y jugar con Bartolito, la vaca Lola, el lorito Pepe, el caballo Percherón, Doña Pancha y el travieso Lobo Beto, mientras recorren y descubren los lugares más diversos: selvas, playas, montañas, lagos, ríos, pequeños pueblos, grandes ciudades y lugares fantásticos y misteriosos como un hermoso camino con los colores del arcoíris. A través de las canciones más divertidas, La Granja de Zenón a Rodar, nos brindará hermosas experiencias de entretenimiento y aprendizaje para ser disfrutadas por los más pequeños del hogar.
👨🏼🌾 La Granja de Zenón, un serie para niños donde de forma sencilla y entretenida aprenderás la vida y las costumbres del campo, el amor hacia los animales, así como el cuidado de la tierra. Valores como la amistad, el amor, la suerte, el optimismo, las travesuras y muchas aventuras, son las que vivirás con nuestros animales de la granja y nuestro granjero favorito Zenón.
🐞 Bichikids es un universo lleno de simpáticos bichitos, muy curiosos, alegres y ¡con muchas ganas de divertirse! En cada capítulo los Bichikids se encuentran con nuevas situaciones al igual que nuestros niños. También aprenderán de forma divertida, texturas, aromas, comidas, sonidos, música, baile y valores como la amistad.
🦁 En Canciones del Zoo verás a los animales viven libremente cantando, bailando y se divierten todos tanto que no piensan marcharse. Cuidados por el Tío Mario, su veterinario, este zoo-hospital recibe a todo tipo de animales que vienen a curar cualquier dolencia. Casi siempre están también Pedro, Mario, Mía y Teo que cada día vienen de visita en busca de nuevas historias y fantásticas aventuras. ¡Es fascinante todo lo que se aprende de los animales y de lo mucho que sabe el Tío Mario! Le ayudan a investigar, a alimentarlos y juntos aprenden a estar en contacto con los animales y a observar su comportamiento.
Título original: El camino arcoíris (Rainbow Road)
Autor: (Dominio Público - Adaptación: Altamirano, Paola - Mort, Eddie)
Interprete: Sandra Rivera

SUSCRIBETE AQUÍ: https://bit.ly/3B8CNXP
Letra
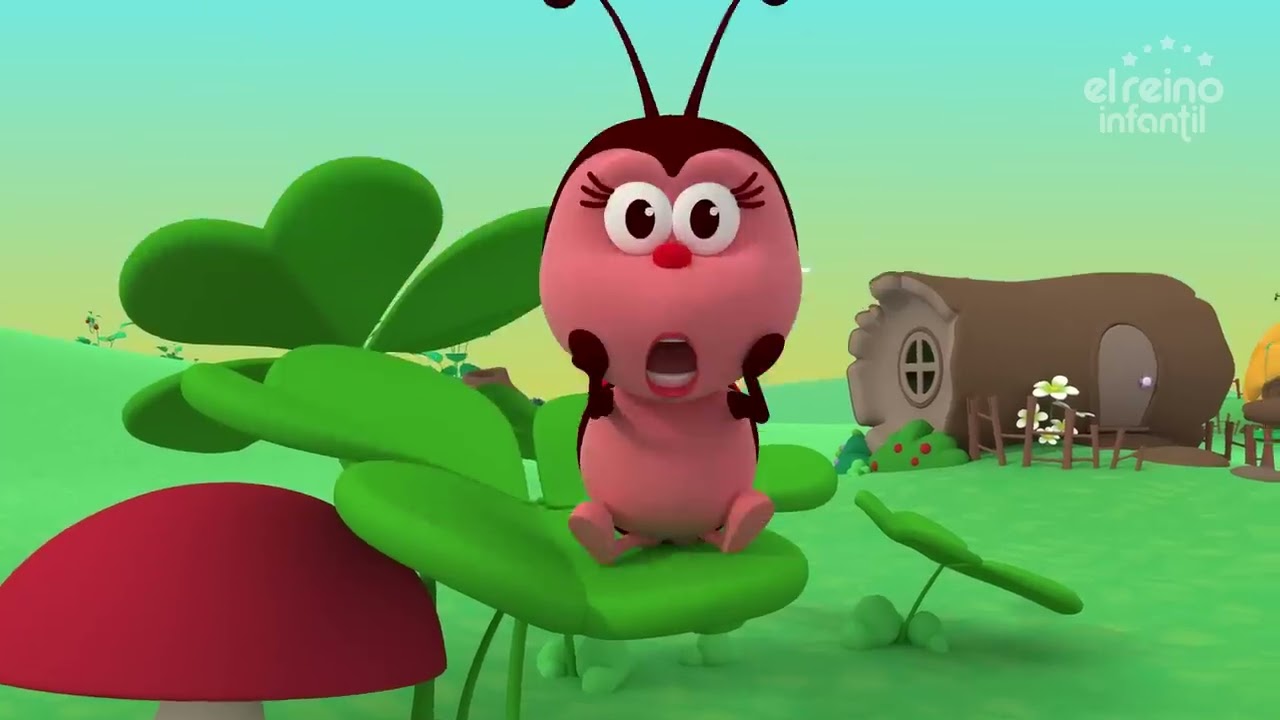
Una pulga aventurera, decidió salir de viaje
preparó su equipaje y a la puerta se asomó.
Vino un perro muy lanudo, caminando muy tranquilo
"Uy, ahí viene el colectivo" dijo la pulga y saltó.
Y así sí sí, viajó jó jó
en la oreja de un perro lanudo
La pulga, ga, viajera, ra
quién sabe hasta dónde llegó.
Y así sí sí, viajó jó jó
en la oreja de un perro lanudo
La pulga, ga, viajera, ra
quién sabe hasta dónde llegó.
Una pulga aventurera, decidió salir de viaje
preparó su equipaje y a la puerta se asomó.
Vino un perro muy lanudo, caminando muy tranquilo
"Uy, ahí viene el colectivo" dijo la pulga y saltó.
Y así sí sí, viajó jó jó
en la oreja de un perro lanudo
La pulga, ga, viajera, ra
quién sabe hasta dónde llegó.
Y así sí sí, viajó jó jó
en la oreja de un perro lanudo
La pulga, ga viajera, ra
quién sabe hasta dónde llegó.
Suscríbete ► http://bit.ly/SuscribeteElReinoInfantil
Síguenos/Follow us:
Facebook ► https://www.facebook.com/ElReinoInfantil
Instagram► https://www.instagram.com/reino_infantil/
Twitter ► https://twitter.com/Reino_Infantil
¡Encuentra todos nuestros productos exclusivos aquí!
►http://bit.ly/ElReinoInfantilWEB
Título Original: La Pulga Aventurera
Autor/Compositor: Desconocido
Intérprete: Karina Antonelli

SUSCRIBETE AQUÍ: https://bit.ly/3B8CNXP
Suscríbete ► http://bit.ly/SuscribeteElReinoInfantil
Síguenos/Follow us:
Facebook ► https://www.facebook.com/ElReinoInfantil
Instagram► https://www.instagram.com/reino_infantil/
Twitter ► https://twitter.com/Reino_Infantil
¿Quieres más videos? ¡Escucha esta divertida playlist de canciones del Reino Infantil!
►http://bit.ly/ElReinoInfantilPlaylist
¡Encuentra todos nuestros productos exclusivos aquí!
►http://bit.ly/ElReinoInfantilWEB
Lela Es Mi Pelela - La Familia Blu 3 | El Reino Infantil
Título: Lela es mi Pelela
Autor/Compositor: (López, Atilio Rubén (Seudonimo: Rubén López Riant) - Miranda, María Inés (Seudonimo: Maris Miranda))
Intérprete: Sofy Schiaffino
SUSCRIBETE AQUÍ:
https://bit.ly/3B8CNXP Suscríbete ► http://bit.ly/SuscribeteElReinoInfantil
Síguenos/Follow us:
Facebook ► https://www.facebook.com/ElReinoInfantil
Instagram► https://www.instagram.com/reino_infantil/
Twitter ► https://twitter.com/Reino_Infantil
¡Encuentra todos nuestros productos exclusivos aquí!
►http://bit.ly/ElReinoInfantilWEB
La Brujita Tapita - Rondas y Clásicos Infantiles | El Reino Infantil
(Rogier, Cecilia María Teresa)

SUSCRIBETE AQUÍ: https://bit.ly/3B8CNXP
Canta con la NUEVA CANCIÓN de la Granja de Zenón ¡¡¡LA VACA LOLA Y YO!!! https://youtu.be/4ZV07OqiVoQ
Letra
♫ Mu mu mu mu ♫
Señora Vaca, Señora Vaca
Yo le doy gracias por todo lo que nos da
hoy mi maestra nos ha enseñado
que en su cuerpito usted trabaja sin cesar.
Y nos da la leche
el dulce de leche
y la manteca que siempre le pongo al pan.
También el queso que es tan sano
y un yogur para mi hermano.
Señora Vaca, usted sabe trabajar.
Y nos da la leche
el dulce de leche
y la manteca que siempre le pongo al pan.
También el queso que es tan sano
y un yogur para mi hermano.
Señora Vaca, usted sabe trabajar.
♫ Mu mu mu mu ♫
Señora Vaca, Señora Vaca
Cuando en el campo yo la veo a usted pasear
con sus hijitos, le tiro un besito
pues me doy cuenta que es una buena mamá.
Y nos da la leche
el dulce de leche
y la manteca que siempre le pongo al pan.
También el queso que es tan sano
y un yogur para mi hermano.
Señora Vaca, usted sabe trabajar.
Y nos da la leche
el dulce de leche
y la manteca que siempre le pongo al pan.
También el queso que es tan sano
y un yogur para mi hermano.
Señora Vaca, usted sabe trabajar.
Título Original: Señora Vaca
Autor/Compositor: Ramírez, Francisco Pablo - Ramírez Ces. Der. Mastellone
Intérprete: Gonza & Clarita
Suscríbete ► http://bit.ly/SuscribeteElReinoInfantil
Síguenos/Follow us:
Facebook ► https://www.facebook.com/ElReinoInfantil
Instagram► https://www.instagram.com/reino_infantil/
Twitter ► https://twitter.com/Reino_Infantil
¡Encuentra todos nuestros productos exclusivos aquí!
►http://bit.ly/ElReinoInfantilWEB
¿Aún no conoces el nuevo video de la vaquita más querida de La Granja de Zenón?
Mira “La Vaca Lola Acumulativa” AQUÍ: https://bit.ly/VacaLolaRemix
¡ATENCIÓN ARGENTINA!
Ya puedes encontrar los mini alfajores de La Granja de Zenón en la tienda online de Fantoche: https://bit.ly/FantocheGDZ
También consulta en tu kiosco más cercano. Pronto llegarán a todo el país.
Además, ya puedes usar los filtros de La Vaca Lola en Facebook y en Instagram. Haz click en estos links:
Facebook: https://bit.ly/FiltroLolaFB
Instagram, según tu dispositivo:
https://bit.ly/FiltroLolaInstaLite
https://bit.ly/FiltroLolaInstagram

SUSCRIBETE AQUÍ: https://bit.ly/3B8CNXP
Letra
Tamito, Tamito el hipopotamito,
está aprendiendo a nada.
Con mucho cuidado practica en un charquito,
Tamito no se quiere mojar.
Tamito, Tamito el hipopotamito,
la panza no se quiere mojar.
Con mucho cuidado practica en un charquito,
Un día él podrá ir a nadar.
“Tamito, Tamito” le dice su mama:
“asi no podras avanzar”,
Tamito la escucha y vuelve a comenzar,
Seguro que esta vez va a nadar.
Tamito, Tamito el hipopotamito,
la cola no se quiere mojar.
Con mucho cuidado practica en un charquito,
Un día él podría ir a nadar.
Tamito, Tamito el hipopotamito,
las patas no se quiere mojar.
Con mucho cuidado practica en un charquito,
Un día él podrá ir a nadar.
“Tamito, Tamito” le dice su mama:
“asi no podras avanzar”,
Tamito la escucha y vuelve a comenzar,
Seguro que esta vez va a nadar.
Tamito, Tamito el hipopotamito,
ya sabe un poquito nadar.
Con tantas brazadas que dio en el charquito,
Muy lejos el pudo llegar.
“Tamito, Tamito” le dice su mama:
“te tengo que felicitar”
“Estoy orgullosa, igual que tu papa”,
Por que aprendiste solo a nadar.
Por que aprendiste solo a nadar.
Suscríbete ► http://bit.ly/SuscribeteElReinoInfantil
Síguenos/Follow us:
Facebook ► https://www.facebook.com/ElReinoInfantil
Instagram► https://www.instagram.com/reino_infantil/
Twitter ► https://twitter.com/Reino_Infantil
¿Quieres más videos? ¡Escucha esta divertida playlist de Las Canciones del Zoo!
►http://bit.ly/PlaylistCancionesZOO
¡Encuentra todos nuestros productos exclusivos aquí!
►http://bit.ly/ElReinoInfantilWEB
Tamito el Hipopotamito - La Canciones del Zoo 4 | El Reino Infantil
Título: Tamito el Hipopotamito
Autor/Compositor: (Vinelli, Liliana Carmen)
Intérprete: Dúo Tiempo de Sol

SUSCRIBETE AQUÍ: https://bit.ly/3B8CNXP
Letra
Estaba La Rana sentada
cantando debajo del agua
cuando La Rana salió a cantar
vino La Mosca y la hizo callar
La Mosca a La Rana que estaba sentada
cantando debajo del agua
cuando La Mosca salió a cantar
vino La Araña y la hizo callar
La Araña a La Mosca, La Mosca a La Rana
que estaba sentada
cantando debajo del agua
cuando La Araña salió a cantar
vino El Ratón y la hizo callar
El Ratón a La Araña, La Araña a La Mosca
La Mosca a La Rana que estaba sentada
cantando debajo del agua
cuando El Ratón salió a cantar
vino El Gato y lo hizo callar
El Gato al Ratón, El Ratón a La Araña
La Araña a La Mosca, la Mosca a La Rana
que estaba sentada cantando debajo del agua
cuando El Gato salió a cantar
vino El Perro y lo hizo callar
El Perro al Gato, El Gato al Ratón
El Ratón a La Araña, La Araña a La Mosca
La Mosca a La Rana que estaba sentada
cantando debajo del agua
cuando El Perro salió a cantar
vino el hombre y lo hizo callar
El hombre al Perro, El Perro al Gato
El Gato al Ratón, El Ratón a La Araña
La Araña a La Mosca, La Mosca a La Rana
que estaba sentada
cantando debajo del agua
cuando el hombre salió a cantar
vino la suegra y lo hizo callar
La suegra al hombre, el hombre al Perro
El Perro al Gato, El Gato al Ratón
El Ratón a La Araña, La Araña a La Mosca
La Mosca a La Rana que estaba sentada
cantando debajo del agua
cuando la suegra salió a cantar…
ni el mismo diablo la pudo callar.
Suscríbete ► http://bit.ly/SuscribeteElReinoInfantil
Síguenos/Follow us:
Facebook ► https://www.facebook.com/ElReinoInfantil
Instagram► https://www.instagram.com/reino_infantil/
Twitter ► https://twitter.com/Reino_Infantil
¡Encuentra todos nuestros productos exclusivos aquí!
►http://bit.ly/ElReinoInfantilWEB
La Rana - Canciones de la Granja de Zenón 2
(Motivo popular)
Los Pollitos
SUSCRIBETE AQUÍ: https://bit.ly/3B8CNXP
Suscríbete ► http://bit.ly/SuscribeteElReinoInfantil
Síguenos/Follow us:
Facebook ► https://www.facebook.com/ElReinoInfantil
Instagram► https://www.instagram.com/reino_infantil/
Twitter ► https://twitter.com/Reino_Infantil
¡Encuentra todos nuestros productos exclusivos aquí!
►http://bit.ly/ElReinoInfantilWEB
Título Original: La Granja de Zenón
Autor/Compositor: Marceillac, Eduardo Alberto - Rogier, Cecilia María Teresa
Intérprete: Dúo Tiempo de Sol

SUSCRIBETE AQUÍ: https://bit.ly/3B8CNXP
Suscríbete ► http://bit.ly/SuscribeteElReinoInfantil
Síguenos/Follow us:
Facebook ► https://www.facebook.com/ElReinoInfantil
Instagram► https://www.instagram.com/reino_infantil/
Twitter ► https://twitter.com/Reino_Infantil
¡Encuentra todos nuestros productos exclusivos aquí!
►http://bit.ly/ElReinoInfantilWEB
El Gato Tom - Michi-guau | El Reino Infantil
(Ratti, Marcelo) Ayelén Marceillac y Canta: Santiago Agopian Braida, Melina Gabin, Martina Riobo, Emilia Pensa Cervone, Thiago Brei, Nicolás Freddi, Donatella Sansone, Pilar Arrube, Constanza Ramírez, Bautista Ramírez, Juana Mignori, Mercedes Lapits Soria, Rosario Presas, Conrado Notta

SUSCRIBETE AQUÍ: https://bit.ly/3B8CNXP
Suscríbete ► http://bit.ly/SuscribeteElReinoInfantil
Síguenos/Follow us:
Facebook ► https://www.facebook.com/ElReinoInfantil
Instagram► https://www.instagram.com/reino_infantil/
Twitter ► https://twitter.com/Reino_Infantil
¿Quieres más videos? ¡Escucha esta divertida playlist de canciones del Reino Infantil!
►http://bit.ly/ElReinoInfantilPlaylist
¡Encuentra todos nuestros productos exclusivos aquí!
►http://bit.ly/ElReinoInfantilWEB
Título Original: Exacto Granja
Autor/Compositor: Natale, Mario - Turatti, Roberto - Salvi, Francesco - Giuliani, Mauro - Melloni, Silvio - Versionista: Di Lorenzo, Giorgio
Intérprete: Ignacio Rodríguez De Anca
¡ATENCIÓN AMIGOS DE ESPAÑA!
¡Llegaron los nuevos productos de La Granja de Zenón, junto a Bandai!
¡Ideales para que tus peques jueguen y aprendan con sus personajes favoritos!
Consíguelos en Amazon a través de los siguientes links:
Pack amigos de La Granja de Zenón: https://bit.ly/PackLGDZBandaiAmazon
Cubo con sonidos – Aprende las vocales: https://bit.ly/CubosAmazon
SUSCRIBETE AQUÍ: https://bit.ly/3B8CNXP
Suscríbete ► http://bit.ly/SuscribeteElReinoInfantil
Letra
Con la A A A
mi casita es de cristal.
Con la E E E
mi casita es de papel.
Con la I I I
mi casita es de marfil.
Con la O O O
mi casita es de cartón.
Con la U U U
mi casita es azul.
Con la A A A
yo saludo a mi mamá.
Con la E E E
yo saludo con el pié.
Con la I I I
te saluda mi naríz.
Con la O O O
te saludo con mi voz.
Con la U U U
ahora me saludas ¡tú!
Síguenos/Follow us:
Facebook ► https://www.facebook.com/ElReinoInfantil
Instagram► https://www.instagram.com/reino_infantil/
Twitter ► https://twitter.com/Reino_Infantil
¡Encuentra todos nuestros productos exclusivos aquí!
►http://bit.ly/ElReinoInfantilWEB
Título original: Con la A A A
Autores: Marceillac, Eduardo Alberto - Rogier, Cecilia María Teresa
Intérprete: Dúo Tiempo de Sol
