Please note that if you are under 18, you won't be able to access this site.
Are you 18 years old or above?
Create
Upload
Import
My Account
Mode
Login
Register
Math
Science
History
Social studies
Language Arts
World language
Art
AI
Other
Up next
Autoplay
00:02:45
Gemini destripado a fondo #ia #ai #inteligenciaartificial #chatgpt #bigdata #data #bilbao #googleai
Teacherflix
3 Views
·
06/07/26
AI
00:04:43
FREE Google Gemini Certifications 2025 | Students & Teachers Must Watch | Data Analyst Bootcamp
Teacherflix
12 Views
·
04/18/26
AI
00:02:28
Starlink Is Training AI With Your Data (Here's How to Opt Out)
Teacherflix
10 Views
·
02/11/26
00:02:28
Starlink Is Training AI With Your Data (Here's How to Opt Out)
Teacherflix
8 Views
·
02/11/26
00:02:58
Data Analysis and Probability
Teacherflix
6 Views
·
10/25/25
Science
00:02:17
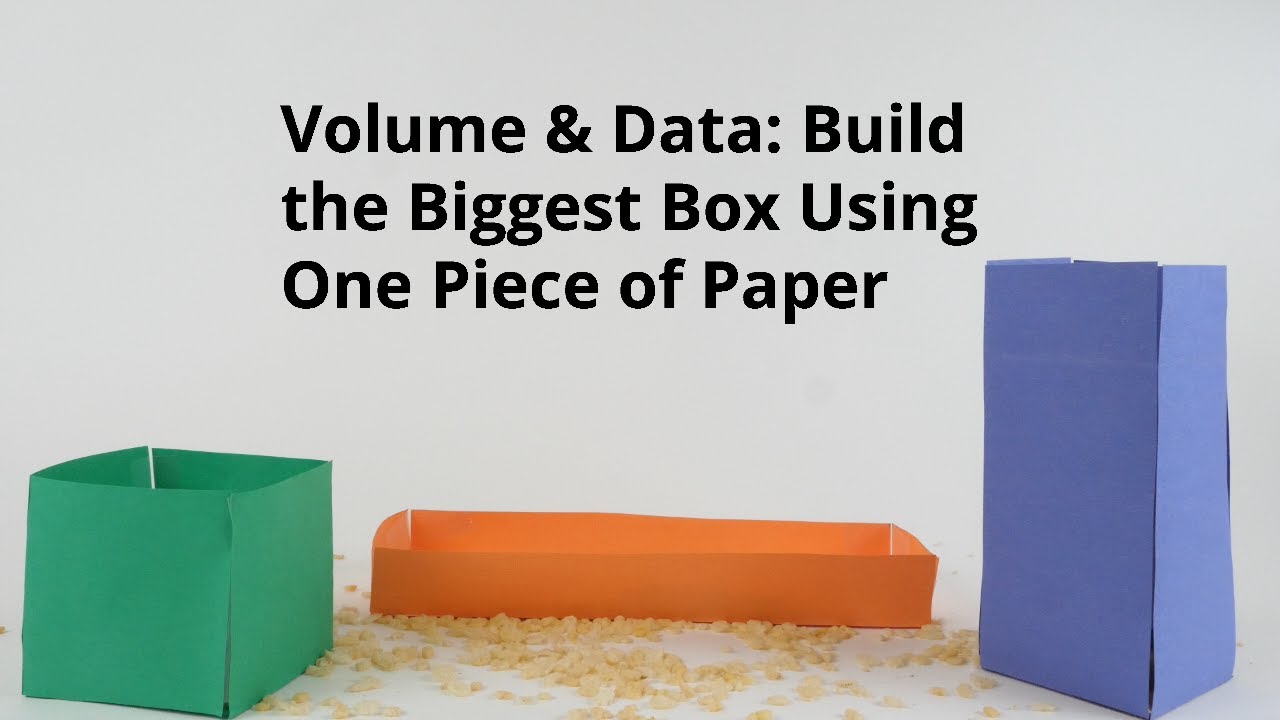
Volume & Data: Build the Biggest Box Using One Piece of Paper
Teacherflix
29 Views
·
10/25/25
Science
00:07:08
How Sweet Are You? Engineering Smarter Solutions for Diabetes with Data-Driven AI
Teacherflix
10 Views
·
10/25/25
Science
00:02:29
Dan Katzir on Why Data Matter
Teacherflix
6 Views
·
10/25/25
00:08:12
How to collect ANY DATA from the web using THIS unknown AI Tool?! Bright Data Review...
Teacherflix
18 Views
·
10/14/25
00:05:38
Is Big Data Getting Too Big?
Teacherflix
5 Views
·
10/04/25
Science
00:08:46
Why Anecdotes Trump Data
Teacherflix
1 Views
·
10/04/25
Science
00:03:04
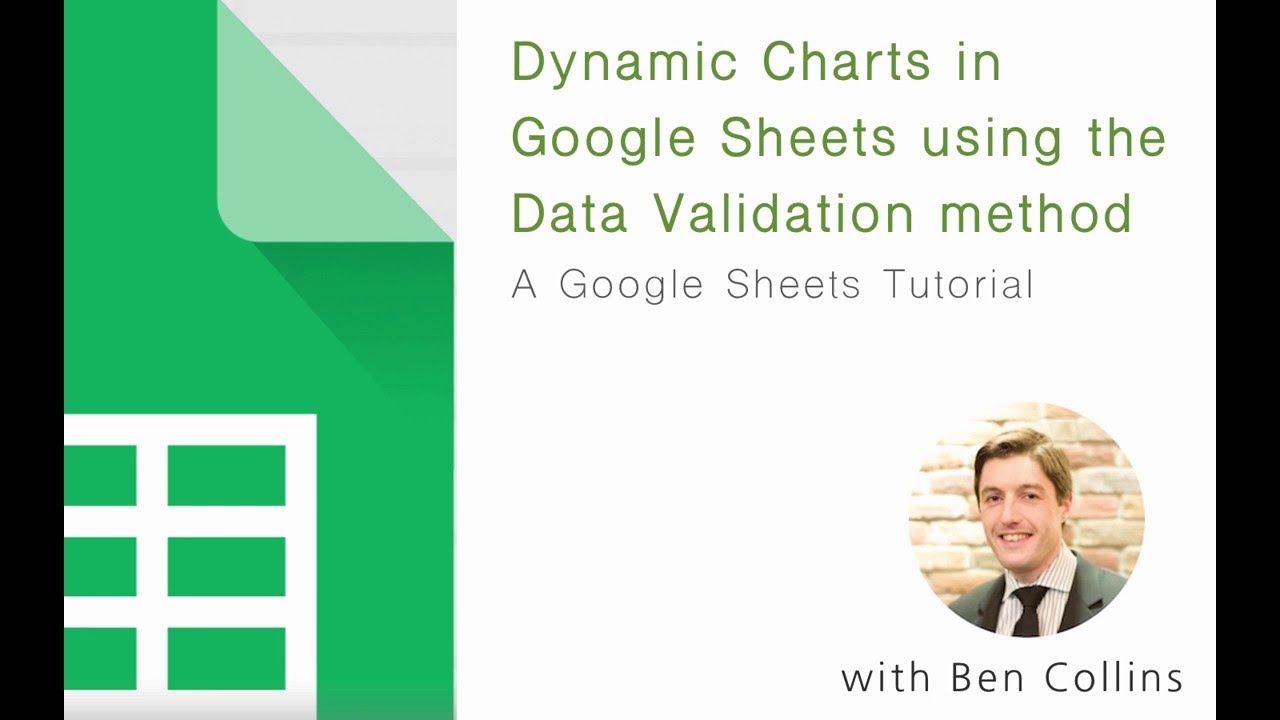
Dynamic charts in Google Sheets with data validation
Teacherflix
57 Views
·
02/01/25
Math
00:51:50
Google Sheets Charts - Advanced- Data Labels, Secondary Axis, Filter, Multiple Series, Legends Etc.
Teacherflix
24 Views
·
02/01/25
Math
00:04:24
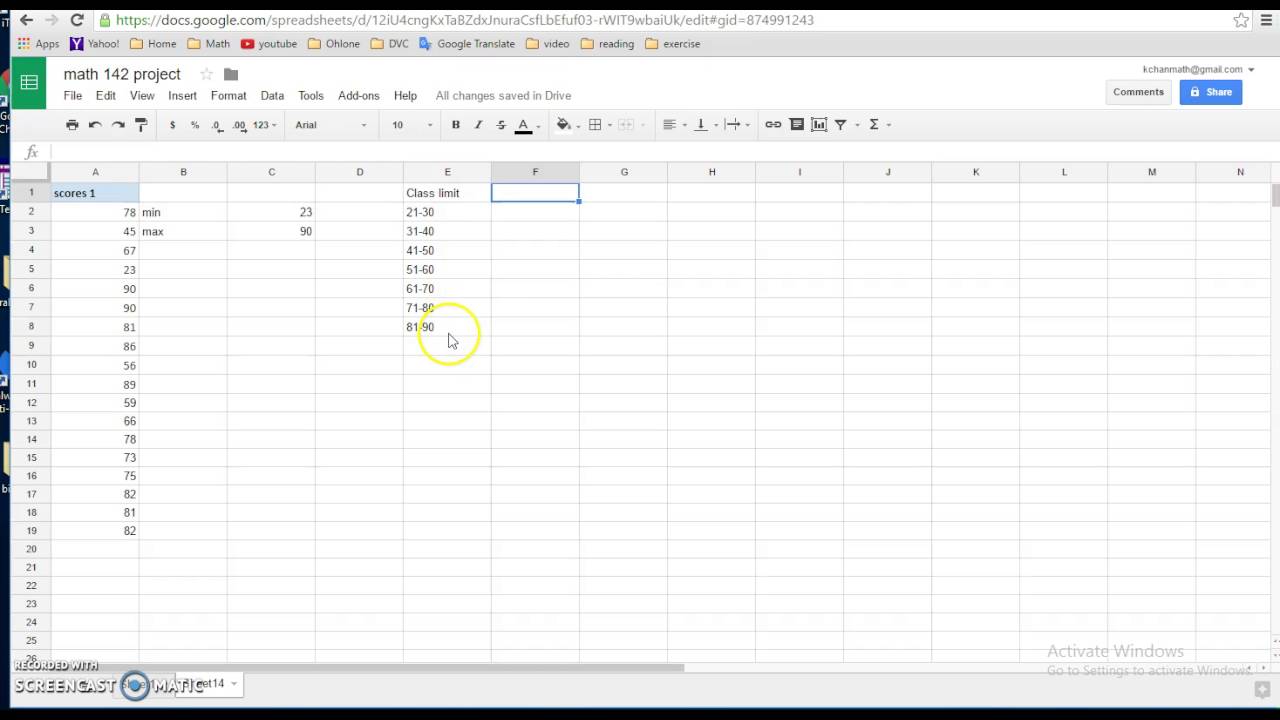
Use Google sheets to make frequency distribution for quantitative data
Teacherflix
24 Views
·
02/01/25
Math
00:07:17
How To Make A Graph On Google Sheets With Multiple Data Sets & Independent Variables
Teacherflix
6 Views
·
02/01/25
Math
00:05:25
Comparing dot plots, histograms, and box plots | Data and statistics | 6th grade | Khan Academy
Teacherflix
97 Views
·
04/01/24
00:06:22
Two-way frequency tables and Venn diagrams | Data and modeling | 8th grade | Khan Academy
Teacherflix
14 Views
·
04/01/24
00:06:22
Two-way frequency tables and Venn diagrams | Data and modeling | 8th grade | Khan Academy
Teacherflix
8 Views
·
04/01/24
00:08:54
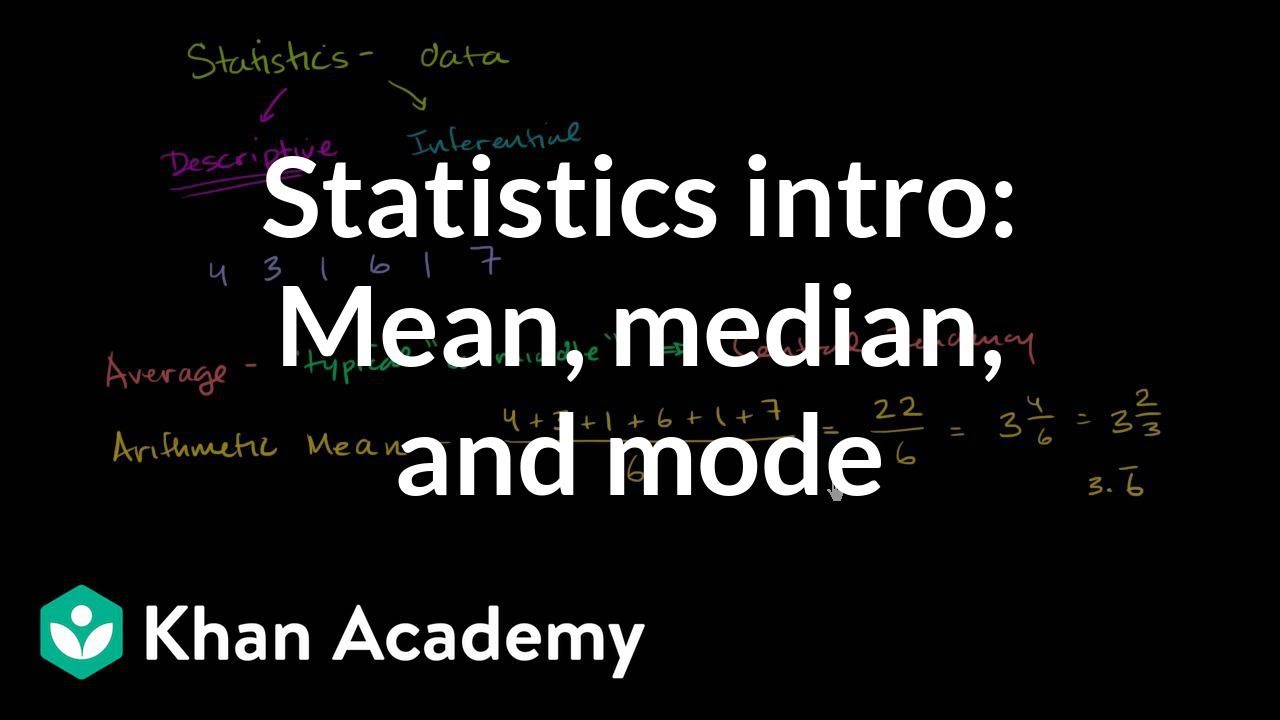
Statistics intro: Mean, median, and mode | Data and statistics | 6th grade | Khan Academy
Teacherflix
9 Views
·
04/01/24
00:05:43
Representing data with matrices | Matrices | Precalculus | Khan Academy
Teacherflix
4 Views
·
04/01/24
Load more
Decile for Grouped Data
0
0
2
Views
·
03/10/24
Share
Embed
Teacherflix
5 Subscribers
Subscribe
5
In
Math
#decile
Show more
0 Comments
sort
Sort By
Top Comments
Latest comments
Publish
Up next
Autoplay
00:02:45
Gemini destripado a fondo #ia #ai #inteligenciaartificial #chatgpt #bigdata #data #bilbao #googleai
Teacherflix
3 Views
·
06/07/26
AI
00:04:43
FREE Google Gemini Certifications 2025 | Students & Teachers Must Watch | Data Analyst Bootcamp
Teacherflix
12 Views
·
04/18/26
AI
00:02:28
Starlink Is Training AI With Your Data (Here's How to Opt Out)
Teacherflix
10 Views
·
02/11/26
00:02:28
Starlink Is Training AI With Your Data (Here's How to Opt Out)
Teacherflix
8 Views
·
02/11/26
00:02:58
Data Analysis and Probability
Teacherflix
6 Views
·
10/25/25
Science
00:02:17
Volume & Data: Build the Biggest Box Using One Piece of Paper
Teacherflix
29 Views
·
10/25/25
Science
00:07:08
How Sweet Are You? Engineering Smarter Solutions for Diabetes with Data-Driven AI
Teacherflix
10 Views
·
10/25/25
Science
00:02:29
Dan Katzir on Why Data Matter
Teacherflix
6 Views
·
10/25/25
00:08:12
How to collect ANY DATA from the web using THIS unknown AI Tool?! Bright Data Review...
Teacherflix
18 Views
·
10/14/25
00:05:38
Is Big Data Getting Too Big?
Teacherflix
5 Views
·
10/04/25
Science
00:08:46
Why Anecdotes Trump Data
Teacherflix
1 Views
·
10/04/25
Science
00:03:04
Dynamic charts in Google Sheets with data validation
Teacherflix
57 Views
·
02/01/25
Math
00:51:50
Google Sheets Charts - Advanced- Data Labels, Secondary Axis, Filter, Multiple Series, Legends Etc.
Teacherflix
24 Views
·
02/01/25
Math
00:04:24
Use Google sheets to make frequency distribution for quantitative data
Teacherflix
24 Views
·
02/01/25
Math
00:07:17
How To Make A Graph On Google Sheets With Multiple Data Sets & Independent Variables
Teacherflix
6 Views
·
02/01/25
Math
00:05:25
Comparing dot plots, histograms, and box plots | Data and statistics | 6th grade | Khan Academy
Teacherflix
97 Views
·
04/01/24
00:06:22
Two-way frequency tables and Venn diagrams | Data and modeling | 8th grade | Khan Academy
Teacherflix
14 Views
·
04/01/24
00:06:22
Two-way frequency tables and Venn diagrams | Data and modeling | 8th grade | Khan Academy
Teacherflix
8 Views
·
04/01/24
00:08:54
Statistics intro: Mean, median, and mode | Data and statistics | 6th grade | Khan Academy
Teacherflix
9 Views
·
04/01/24
00:05:43
Representing data with matrices | Matrices | Precalculus | Khan Academy
Teacherflix
4 Views
·
04/01/24
Share
Embed
Home
Articles
Latest videos
Trending
Top videos
Popular Channels
Explore more
Help
Choose a payment method
Language
English
Arabic
Dutch
French
German
Russian
Spanish
Turkish
Hindi
Chinese
Urdu
Indonesian
Croatian
Hebrew
Bengali
Japanese
Portuguese
Italian
Persian
Swedish
Vietnamese
Danish
Filipino
Pay By Wallet
Log In
Username
Password
Forgot your password?
Remember this device
New here?
Register
Sign Up!
Username
E-mail address
Password
Must be at least 6 characters long.
Must contain a lowercase letter.
Must contain an uppercase letter.
Must contain a number or special character.
Confirm Password
Male
Female
By creating your account, you agree to our
Terms of use
&
Privacy Policy
Already have an account?
Log In