18 歳未満の方は、このサイトにアクセスできませんのでご注意ください。
あなたは18歳以上ですか?
作成
アップロード
輸入
マイアカウント
モード
ログイン
登録
映画とアニメーション
他の
次に
自動再生
00:02:45
Gemini destripado a fondo #ia #ai #inteligenciaartificial #chatgpt #bigdata #data #bilbao #googleai
Teacherflix
3 ビュー
·
06/07/26
00:04:43
FREE Google Gemini Certifications 2025 | Students & Teachers Must Watch | Data Analyst Bootcamp
Teacherflix
12 ビュー
·
04/18/26
00:02:28
Starlink Is Training AI With Your Data (Here's How to Opt Out)
Teacherflix
10 ビュー
·
02/11/26
00:02:28
Starlink Is Training AI With Your Data (Here's How to Opt Out)
Teacherflix
8 ビュー
·
02/11/26
00:02:58
Data Analysis and Probability
Teacherflix
6 ビュー
·
10/25/25
00:02:17
Volume & Data: Build the Biggest Box Using One Piece of Paper
Teacherflix
30 ビュー
·
10/25/25
00:07:08
How Sweet Are You? Engineering Smarter Solutions for Diabetes with Data-Driven AI
Teacherflix
10 ビュー
·
10/25/25
00:02:29
Dan Katzir on Why Data Matter
Teacherflix
6 ビュー
·
10/25/25
00:08:12
How to collect ANY DATA from the web using THIS unknown AI Tool?! Bright Data Review...
Teacherflix
18 ビュー
·
10/14/25
00:05:38
Is Big Data Getting Too Big?
Teacherflix
5 ビュー
·
10/04/25
00:08:46
Why Anecdotes Trump Data
Teacherflix
1 ビュー
·
10/04/25
00:03:04
Dynamic charts in Google Sheets with data validation
Teacherflix
57 ビュー
·
02/01/25
映画とアニメーション
00:51:50
Google Sheets Charts - Advanced- Data Labels, Secondary Axis, Filter, Multiple Series, Legends Etc.
Teacherflix
24 ビュー
·
02/01/25
映画とアニメーション
00:04:24
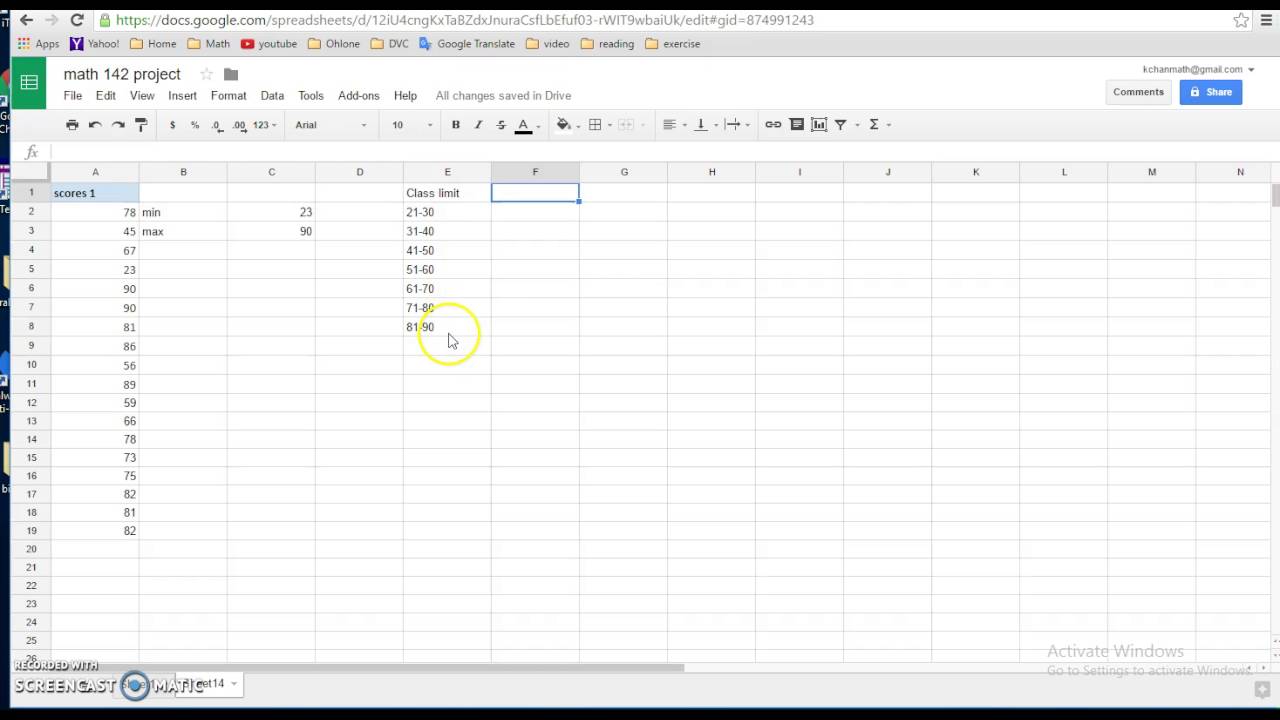
Use Google sheets to make frequency distribution for quantitative data
Teacherflix
24 ビュー
·
02/01/25
映画とアニメーション
00:07:17
How To Make A Graph On Google Sheets With Multiple Data Sets & Independent Variables
Teacherflix
6 ビュー
·
02/01/25
映画とアニメーション
00:05:25
Comparing dot plots, histograms, and box plots | Data and statistics | 6th grade | Khan Academy
Teacherflix
97 ビュー
·
04/01/24
00:06:22
Two-way frequency tables and Venn diagrams | Data and modeling | 8th grade | Khan Academy
Teacherflix
14 ビュー
·
04/01/24
00:06:22
Two-way frequency tables and Venn diagrams | Data and modeling | 8th grade | Khan Academy
Teacherflix
8 ビュー
·
04/01/24
00:08:54
Statistics intro: Mean, median, and mode | Data and statistics | 6th grade | Khan Academy
Teacherflix
9 ビュー
·
04/01/24
00:05:43
Representing data with matrices | Matrices | Precalculus | Khan Academy
Teacherflix
4 ビュー
·
04/01/24
もっと読み込む
Percentile for Grouped Data
0
0
5
ビュー
·
03/10/24
シェア
埋め込む
Teacherflix
5 加入者
申し込む
5
の
映画とアニメーション
#percentile
もっと見せる
0 コメント
sort
並び替え
トップコメント
最新のコメント
公開
次に
自動再生
00:02:45
Gemini destripado a fondo #ia #ai #inteligenciaartificial #chatgpt #bigdata #data #bilbao #googleai
Teacherflix
3 ビュー
·
06/07/26
00:04:43
FREE Google Gemini Certifications 2025 | Students & Teachers Must Watch | Data Analyst Bootcamp
Teacherflix
12 ビュー
·
04/18/26
00:02:28
Starlink Is Training AI With Your Data (Here's How to Opt Out)
Teacherflix
10 ビュー
·
02/11/26
00:02:28
Starlink Is Training AI With Your Data (Here's How to Opt Out)
Teacherflix
8 ビュー
·
02/11/26
00:02:58
Data Analysis and Probability
Teacherflix
6 ビュー
·
10/25/25
00:02:17
Volume & Data: Build the Biggest Box Using One Piece of Paper
Teacherflix
30 ビュー
·
10/25/25
00:07:08
How Sweet Are You? Engineering Smarter Solutions for Diabetes with Data-Driven AI
Teacherflix
10 ビュー
·
10/25/25
00:02:29
Dan Katzir on Why Data Matter
Teacherflix
6 ビュー
·
10/25/25
00:08:12
How to collect ANY DATA from the web using THIS unknown AI Tool?! Bright Data Review...
Teacherflix
18 ビュー
·
10/14/25
00:05:38
Is Big Data Getting Too Big?
Teacherflix
5 ビュー
·
10/04/25
00:08:46
Why Anecdotes Trump Data
Teacherflix
1 ビュー
·
10/04/25
00:03:04
Dynamic charts in Google Sheets with data validation
Teacherflix
57 ビュー
·
02/01/25
映画とアニメーション
00:51:50
Google Sheets Charts - Advanced- Data Labels, Secondary Axis, Filter, Multiple Series, Legends Etc.
Teacherflix
24 ビュー
·
02/01/25
映画とアニメーション
00:04:24
Use Google sheets to make frequency distribution for quantitative data
Teacherflix
24 ビュー
·
02/01/25
映画とアニメーション
00:07:17
How To Make A Graph On Google Sheets With Multiple Data Sets & Independent Variables
Teacherflix
6 ビュー
·
02/01/25
映画とアニメーション
00:05:25
Comparing dot plots, histograms, and box plots | Data and statistics | 6th grade | Khan Academy
Teacherflix
97 ビュー
·
04/01/24
00:06:22
Two-way frequency tables and Venn diagrams | Data and modeling | 8th grade | Khan Academy
Teacherflix
14 ビュー
·
04/01/24
00:06:22
Two-way frequency tables and Venn diagrams | Data and modeling | 8th grade | Khan Academy
Teacherflix
8 ビュー
·
04/01/24
00:08:54
Statistics intro: Mean, median, and mode | Data and statistics | 6th grade | Khan Academy
Teacherflix
9 ビュー
·
04/01/24
00:05:43
Representing data with matrices | Matrices | Precalculus | Khan Academy
Teacherflix
4 ビュー
·
04/01/24
シェア
埋め込む
家
記事
最新の動画
トレンド
トップ動画
人気チャンネル
もっと調べる
ヘルプ
お支払い方法の選択
言語
English
Arabic
Dutch
French
German
Russian
Spanish
Turkish
Hindi
Chinese
Urdu
Indonesian
Croatian
Hebrew
Bengali
Japanese
Portuguese
Italian
Persian
Swedish
Vietnamese
Danish
Filipino
ウォレットで支払う
ログインする
ユーザー名
パスワード
パスワードをお忘れですか?
このデバイスを記憶する
ここで新しい?
登録
サインアップ!
ユーザー名
電子メールアドレス
パスワード
長さは 6 文字以上にする必要があります。
小文字を含める必要があります。
大文字を含める必要があります。
数字または特殊文字を含める必要があります。
パスワードを認証する
男
女性
アカウントを作成することにより、あなたは私たちに同意するものとします
利用規約
&
プライバシーポリシー
すでにアカウントをお持ちですか?
ログインする