फिल्म और एनिमेशन

Herzlich Willkommen zurück! In diesem Video zeige ich dir die Spaltenstatisitken für deine Tabellen in Google Sheets.
Leo Office Tutorials - Docs - Sheets - Slides - Word - Excel - PowerPoint - Apps Script
Artikel zum Video: https://leoofficetutorials.com/sheets/452
Kapitelmarken
0:00 Begrüßung & Intro
0:25 Spaltenstatistik
6:25 Fazit & Schluss
Hat dir das Video gefallen? Zeige es mir mit einem Like!
TWITTER: https://twitter.com/LeoTutorials
INSTAGRAM: https://instagram.com/leo_officetutorials
TIKTOK: https://www.tiktok.com/@leoofficetutorials
LINKEDIN: https://bit.ly/3EdhzEZ
FACEBOOK: https://bit.ly/3Ecqw1t
Abonnieren nicht vergessen ;)
Hast du Fragen? Ab damit in die Kommentare!
Meine Playlist!
Alle Tutorials: https://bit.ly/3bxPVUm
Google Docs: https://bit.ly/2wJq9h1
Google Sheets: https://bit.ly/2vP3gbo
Apps Script: https://bit.ly/3wcRDV8
Google Slides: https://bit.ly/2Jvq6IB
Word Online: https://bit.ly/3aqGB4c
Excel Online: https://bit.ly/3bw0xD6
Power Point Online: https://bit.ly/2KIs6Ry
Word: https://bit.ly/3408AFP
Meine YouTube Shorts: https://bit.ly/3dZgRAv
Word Online: https://www.office.com/launch/word
Excel Online: https://www.office.com/launch/excel
PowerPoint Online: https://www.office.com/launch/powerpoint
Google Docs: https://docs.google.com
Google Sheets: https://sheets.google.com
Google Slides: https://slides.google.com
Für Vorschläge oder Videowünsche schreibt mir bitte auf Instagram.
Intro Musik: Cat Shat in the Box - josh pan
https://www.youtube.com/c/joshpan89
Endcard Musik: JPB & MYRNE - Feels Right (ft. Yung Fusion)
https://www.youtube.com/watch?v=dXYFK-jEr8Y
Kanal: https://youtube.com/Leoofficetutorials
#sheets #googlesheets #tutorial


Herzlich Willkommen zurück! In diesem Video zeige ich dir wie du eine Wahscheinlichkeit mit der Poisson Verteilung in Sheets berechnen kannst.
Leo Office Tutorials - Docs - Sheets - Slides - Word - Excel - PowerPoint - Apps Script
Artikel zum Video: https://leoofficetutorials.com..../sheets/statistik/51
Kapitelmarken
0:00 Begrüßung & Intro
0:30 Poisson Verteilung
3:06 Benannte Funktion für Poisson Verteilung
4:35 Poisson Wahrscheinlichkeit kumuliert
6:00 Fazit & Schluss
Kanalmitglied werden und exklusive Vorteile erhalten:
https://www.youtube.com/channe....l/UCZM2U4pbqvSia_-kE
Hat dir das Video gefallen? Zeige es mir mit einem Like!
TWITTER: https://twitter.com/LeoTutorials
INSTAGRAM: https://instagram.com/leo_officetutorials
TIKTOK: https://www.tiktok.com/@leoofficetutorials
LINKEDIN: https://bit.ly/3EdhzEZ
FACEBOOK: https://bit.ly/3Ecqw1t
Abonnieren nicht vergessen ;)
Hast du Fragen? Ab damit in die Kommentare!
Meine Playlist!
Alle Tutorials: https://bit.ly/3bxPVUm
Google Docs: https://bit.ly/2wJq9h1
Google Sheets: https://bit.ly/2vP3gbo
Apps Script: https://bit.ly/3wcRDV8
Google Slides: https://bit.ly/2Jvq6IB
Word Online: https://bit.ly/3aqGB4c
Excel Online: https://bit.ly/3bw0xD6
Power Point Online: https://bit.ly/2KIs6Ry
Word: https://bit.ly/3408AFP
Meine YouTube Shorts: https://bit.ly/3dZgRAv
Word Online: https://www.office.com/launch/word
Excel Online: https://www.office.com/launch/excel
PowerPoint Online: https://www.office.com/launch/powerpoint
Google Docs: https://docs.google.com
Google Sheets: https://sheets.google.com
Google Slides: https://slides.google.com
Für Vorschläge oder Videowünsche schreibt mir bitte auf Instagram.
Intro Musik: Cat Shat in the Box - josh pan
https://www.youtube.com/c/joshpan89
Endcard Musik: JPB & MYRNE - Feels Right (ft. Yung Fusion)
https://www.youtube.com/watch?v=dXYFK-jEr8Y
Kanal: https://youtube.com/Leoofficetutorials
#tutorial #googlesheets #sheets #statistik

How To Make A Graph On Google Sheets With Multiple Data Sets & Independent Variables
If you are learning how to make graphs on google sheets this video will help. I will show you how to create a chart on google sheets using a data table as well as add a second set of data on the same chart. Google sheets does not allow you to add multiple independent variables so you have to use this to be able to do so. This was used in my physics lab for the velocity of a cart.
💥**THE DATA FOR THIS LAB IS FOUND IN THIS VIDEO**💥
https://youtu.be/I9OLuUMEfjM
🔥Review Books I Use & Recommend🔥
SAT Physics: https://amzn.to/3jA8CeT
AP Physics 1:https://amzn.to/32MtklD
NY Regents Physics: https://amzn.to/30GqVpP
AP CALC: https://amzn.to/3lhAe9u
If there is a topic you want me to do leave them in the comments below.
#physicstutor #mathtutor
DISCLAIMER: The content discussed in these videos are solely my opinion and I have on affiliation with the SAT/College Board or any other products discussed in this video. This channel is for Educational purposes only. This video and description contain affiliate links, which means that if you click on one of the product links, I’ll receive a small commission at no extra cost to you; all of which helps grow the channel! Thank you for your support!

Weitere Hilfe gefällig? Entdecken Sie unsere Google Schulungen:
https://seibert.biz/googleworkspaceschulungen
Inhalt:
In diesem Tutorial erfahren Sie, wie Sie mit wenigen Klicks Pivot-Tabellen in #GoogleSheets erstellen können, um so Ihre Daten einfacher zu strukturieren und bestimmte Auswertungen im Handumdrehen durchzuführen.
Google Sheets oder auf Deutsch auch Google Tabellen genannt, ist eine Anwendung für Tabellenkalkulationen ähnlich wie Microsoft Excel und Teil von Google Workspace, dem professionellen Office-Paket von Google für Unternehmen.
Weitere Infos zu Google Sheets und Google Workspace: https://google.seibert-media.net

In this video we start a new series on sport science basics.
These videos are designed to help you learn the basics of statistics, data, and sport science analysis so that you are able to answer your related questions. In the first video we will work through calculating descriptive statistics on our dataset.
► Support DSMStrength HERE: https://www.buymeacoffee.com/DSMStrength
►Purchase The Athlete Dashboard HERE: https://tinyurl.com/DSMLTDash
SUBSCRIBE TO DSMSTRENGTH: https://bit.ly/3xRrNH7
[Books I Love] Support the Channel
►Periodization: http://amzn.to/2mOiBDA
►Strength Coach Guide to Excel http://amzn.to/2xAEZ4p
►Strength Coach Playbook: http://amzn.to/2mY9crI
►Principles and Practice of Resistance Training: http://amzn.to/2mM1Jf6
►High Performance Training for Sport: http://amzn.to/2mqWb74
[Connect with Me]
►See all Strength Coach Tutorials: http://bit.ly/2mLU5Bf
►Check our website: http://www.dsmstrength.com
[Social Media]
►Instagram: https://www.instagram.com/dsmstrength
►Twitter: https://twitter.com/dsmstrength
►Facebook Page: https://www.facebook.com/dsmstrength


// Kreisdiagramm in Google Tabellen erstellen und formatieren //
Ein Kreisdiagramm stellt Häufigkeiten in Form von Stücken eines Kreises dar. Kreisdiagramme heißen auch Tortendiagramm oder Kuchendiagramm, weil sie an eben jene erinnern. Zunächst bedarf es der Ermittlung von absoluten Häufigkeiten, die vom abzutragenden Merkmal in der Stichprobe existieren.
In diesem Kreisdiagramm sind das die Noten einer Klasse, die dargestellt werden.
Die Bereiche bzw. Kreissegmente werden zudem formatiert, also eingefärbt, Schriftfarben angepasst, Schriftgrößen geändert und ein Innenring erstellt. Letzteres lässt den Kuchen eher zu einem Donut werden - auch lecker. ;-)
Bei Fragen und Anregungen zu Kreisdiagramm in Google Tabellen erstellen und formatieren, nutzt bitte die Kommentarfunktion. Ob ihr das Video hilfreich fandet, entscheidet ihr mit einem Daumen nach oben oder unten. #statistikampc
Noch mal zum Nachlesen auf meiner Homepage:
========================================
💡 Kreisdiagramm in Google Tabellen: https://bjoernwalther.com/krei....sdiagramm-in-google-
⭐Kanalmitglied⭐ werden:
=======================
https://www.youtube.com/channe....l/UCK1rZmGakkss0bvnx
Zeitstempel ⏰
============
0:00 Einleitung und Ausgangssituation
0:10 Beispieldiagramme
0:24 Vorarbeit: Häufigkeiten zählen
1:48 Kreisdiagramm einfügen
2:46 Kreisdiagramm anpassen - Labels vergeben
3:48 Kreisdiagramm anpassen - Segemente einfärben
4:51 Innenkreis einfügen ("Donut")
Kanal unterstützen? 🙌🏼
===================
Paypal-Spende: https://www.paypal.com/paypalme/BjoernWalther/5
Amazon Affiliate-Link: http://amzn.to/2iBFeG9
Danke für eure Unterstützung! ♥

Herzlich Willkommen zurück! In diesem Video zeige ich dir, wie du mithilfe der Formeln für die lineare Regression diese in Sheets selbst berechnen kannst. Alternativ kannst du die Forecast.Linear Funktion verwenden.
Leo Office Tutorials - Docs - Sheets - Slides - Word - Excel - PowerPoint - Apps Script
Artikel zum Video: https://leoofficetutorials.com..../sheets/statistik/54
Kapitelmarken
0:00 Begrüßung & Intro
0:30 Einführung in das Video
1:22 Berechnungen
4:20 Vorhersage mithilfe der Linearen Regression
5:05 Vergleich zu Forecast.Linear Funktion
6:30 Vergleich mit Diagramm
8:42 Letzte Worte
9:23 Fazit & Schluss
Kanalmitglied werden und exklusive Vorteile erhalten:
https://www.youtube.com/channe....l/UCZM2U4pbqvSia_-kE
Hat dir das Video gefallen? Zeige es mir mit einem Like!
TWITTER: https://twitter.com/LeoTutorials
INSTAGRAM: https://instagram.com/leo_officetutorials
TIKTOK: https://www.tiktok.com/@leoofficetutorials
LINKEDIN: https://bit.ly/3EdhzEZ
FACEBOOK: https://bit.ly/3Ecqw1t
Abonnieren nicht vergessen ;)
Hast du Fragen? Ab damit in die Kommentare!
Meine Playlist!
Alle Tutorials: https://bit.ly/3bxPVUm
Google Docs: https://bit.ly/2wJq9h1
Google Sheets: https://bit.ly/2vP3gbo
Apps Script: https://bit.ly/3wcRDV8
Google Slides: https://bit.ly/2Jvq6IB
Word Online: https://bit.ly/3aqGB4c
Excel Online: https://bit.ly/3bw0xD6
Power Point Online: https://bit.ly/2KIs6Ry
Word: https://bit.ly/3408AFP
Meine YouTube Shorts: https://bit.ly/3dZgRAv
Word Online: https://www.office.com/launch/word
Excel Online: https://www.office.com/launch/excel
PowerPoint Online: https://www.office.com/launch/powerpoint
Google Docs: https://docs.google.com
Google Sheets: https://sheets.google.com
Google Slides: https://slides.google.com
Für Vorschläge oder Videowünsche schreibt mir bitte auf Instagram.
Intro Musik: Cat Shat in the Box - josh pan
https://www.youtube.com/c/joshpan89
Endcard Musik: JPB & MYRNE - Feels Right (ft. Yung Fusion)
https://www.youtube.com/watch?v=dXYFK-jEr8Y
Kanal: https://youtube.com/Leoofficetutorials
#tutorial #googlesheets #sheets #statistik

Herzlich Willkommen zurück! In diesem Video zeige ich dir in Google Sheets, wie du den gewichteten Mittelwert berechnen kannst.
Leo Office Tutorials - Docs - Sheets - Slides - Word - Excel - PowerPoint - Apps Script
Artikel zum Video: https://leoofficetutorials.com..../sheets/statistik/49
Kapitelmarken
0:00 Begrüßung & Intro
0:26 Was ist der gewichtete Mittelwert?
2:00 Gewichteter Mittelwert berechnen
4:55 Fazit & Schluss
Kanalmitglied werden und exklusive Vorteile erhalten:
https://www.youtube.com/channe....l/UCZM2U4pbqvSia_-kE
Hat dir das Video gefallen? Zeige es mir mit einem Like!
TWITTER: https://twitter.com/LeoTutorials
INSTAGRAM: https://instagram.com/leo_officetutorials
TIKTOK: https://www.tiktok.com/@leoofficetutorials
LINKEDIN: https://bit.ly/3EdhzEZ
FACEBOOK: https://bit.ly/3Ecqw1t
Abonnieren nicht vergessen ;)
Hast du Fragen? Ab damit in die Kommentare!
Meine Playlist!
Alle Tutorials: https://bit.ly/3bxPVUm
Google Docs: https://bit.ly/2wJq9h1
Google Sheets: https://bit.ly/2vP3gbo
Apps Script: https://bit.ly/3wcRDV8
Google Slides: https://bit.ly/2Jvq6IB
Word Online: https://bit.ly/3aqGB4c
Excel Online: https://bit.ly/3bw0xD6
Power Point Online: https://bit.ly/2KIs6Ry
Word: https://bit.ly/3408AFP
Meine YouTube Shorts: https://bit.ly/3dZgRAv
Word Online: https://www.office.com/launch/word
Excel Online: https://www.office.com/launch/excel
PowerPoint Online: https://www.office.com/launch/powerpoint
Google Docs: https://docs.google.com
Google Sheets: https://sheets.google.com
Google Slides: https://slides.google.com
Für Vorschläge oder Videowünsche schreibt mir bitte auf Instagram.
Intro Musik: Cat Shat in the Box - josh pan
https://www.youtube.com/c/joshpan89
Endcard Musik: JPB & MYRNE - Feels Right (ft. Yung Fusion)
https://www.youtube.com/watch?v=dXYFK-jEr8Y
Kanal: https://youtube.com/Leoofficetutorials
#tutorial #googlesheets #sheets #statistik

Herzlich Willkommen zurück! In diesem Video zeige ich dir in Google Sheets, wie du den Erwartungswert berechnen kannst.
Leo Office Tutorials - Docs - Sheets - Slides - Word - Excel - PowerPoint - Apps Script
Artikel zum Video: https://leoofficetutorials.com..../sheets/statistik/49
Kapitelmarken
0:00 Begrüßung & Intro
0:26 Erwartungswert berechnen
3:10 Fazit & Schluss
Kanalmitglied werden und exklusive Vorteile erhalten:
https://www.youtube.com/channe....l/UCZM2U4pbqvSia_-kE
Hat dir das Video gefallen? Zeige es mir mit einem Like!
TWITTER: https://twitter.com/LeoTutorials
INSTAGRAM: https://instagram.com/leo_officetutorials
TIKTOK: https://www.tiktok.com/@leoofficetutorials
LINKEDIN: https://bit.ly/3EdhzEZ
FACEBOOK: https://bit.ly/3Ecqw1t
Abonnieren nicht vergessen ;)
Hast du Fragen? Ab damit in die Kommentare!
Meine Playlist!
Alle Tutorials: https://bit.ly/3bxPVUm
Google Docs: https://bit.ly/2wJq9h1
Google Sheets: https://bit.ly/2vP3gbo
Apps Script: https://bit.ly/3wcRDV8
Google Slides: https://bit.ly/2Jvq6IB
Word Online: https://bit.ly/3aqGB4c
Excel Online: https://bit.ly/3bw0xD6
Power Point Online: https://bit.ly/2KIs6Ry
Word: https://bit.ly/3408AFP
Meine YouTube Shorts: https://bit.ly/3dZgRAv
Word Online: https://www.office.com/launch/word
Excel Online: https://www.office.com/launch/excel
PowerPoint Online: https://www.office.com/launch/powerpoint
Google Docs: https://docs.google.com
Google Sheets: https://sheets.google.com
Google Slides: https://slides.google.com
Für Vorschläge oder Videowünsche schreibt mir bitte auf Instagram.
Intro Musik: Cat Shat in the Box - josh pan
https://www.youtube.com/c/joshpan89
Endcard Musik: JPB & MYRNE - Feels Right (ft. Yung Fusion)
https://www.youtube.com/watch?v=dXYFK-jEr8Y
Kanal: https://youtube.com/Leoofficetutorials
#tutorial #googlesheets #sheets #statistik

In Google Spreadsheet wird ein Histogramm genutzt, um die Häufigkeitsverteilung der vorliegenden Daten grafisch darzustellen. In diesem Video wird Schritt für Schritt erklärt wie ein solches erstellt werden kann.
⚡️ Nützliche Lösungen:
https://bitraining.gumroad.com
🚩Kanal einfach hier abonnieren: https://www.youtube.com/channe....l/UC33oGvYD0AKA42r7i

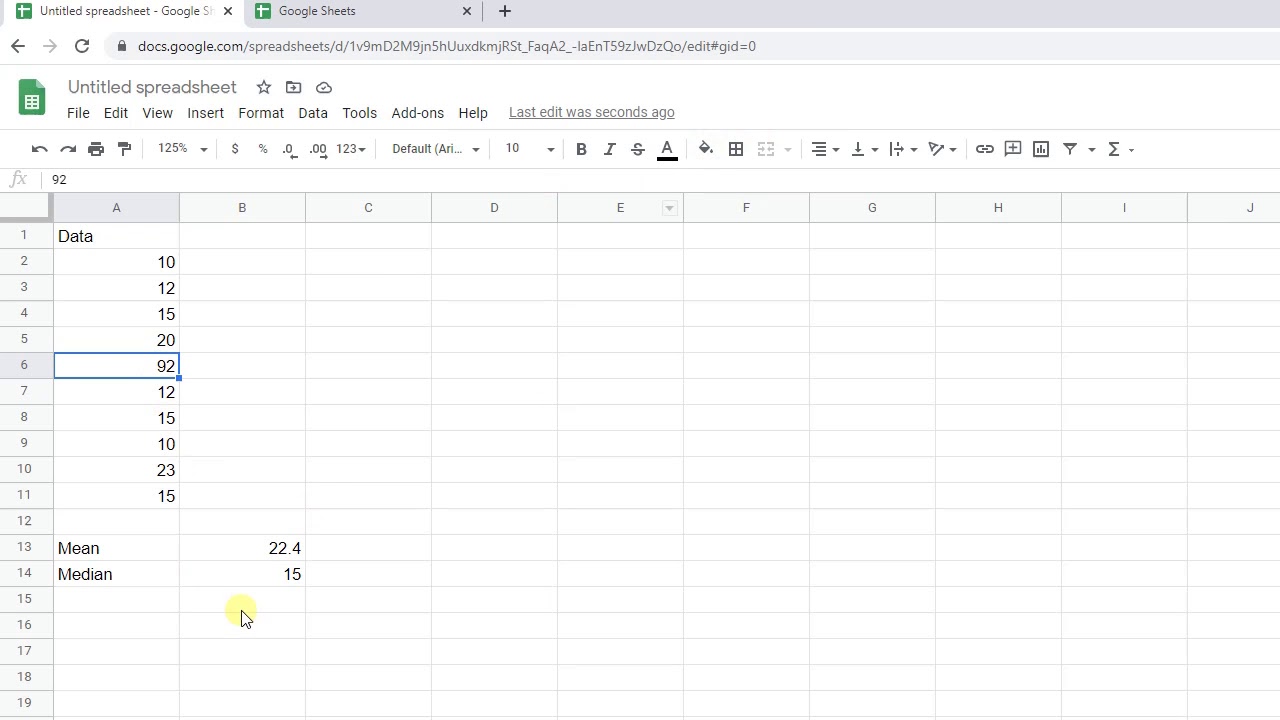
How to do simple descriptive statistics on Google Sheets.

Sie möchten Datenanalyse lernen, aber Programmierung ist nicht Ihre Stärke? Keine Sorge, hier kommt die Lösung. Mit Google Sheets und dem Simple ML Plugin können Sie sofort einfache Vorhersagen treffen - und das kostenlos! Dieses Video führt Sie Schritt für Schritt durch den Prozess der Datenanalyse, einschließlich Regression und Klassifikation. Schauen Sie sich das Video an und starten Sie Ihre Datenanalyse-Reise noch heute!
Link zur GoogleSheets-Datei im Excel-Format: https://docs.google.com/file/d/1CMwfJQTvQ7DM4qGglTAazwXenjnunYjN/edit?usp=docslist_api&filetype=msexcel
0:00 Intro
0:40 Beispiele für KI und Data Science
2:14 Google Sheets und Aufbau einer Datentabelle
3:35 Beispieldatensatz Schwertlilie mit Lücken
5:18 Installation des Plugins Simple ML
5:55 Starten und Erklärung des Plugins Simple ML
8:44 Eigene Datentabelle vorbereiten (Hier Immobilienpreise Chicago)
10:15 Fazit

Herzlich Willkommen zurück! In diesem Video zeige ich dir wie du den Korellationskoeffizienten mithilfe einer Benannten Funktion selbst berechnen kannst.
Leo Office Tutorials - Docs - Sheets - Slides - Word - Excel - PowerPoint - Apps Script
Artikel zum Video: https://leoofficetutorials.com..../sheets/statistik/50
Kapitelmarken
0:00 Begrüßung & Intro
0:32 Korrel Funktion
1:35 Formel für Korellationskoeffizient
4:10 Benannte Funktion
5:28 Benannte Funktion verwenden
7:35 Abschließende Worte
8:35 Fazit & Schluss
Kanalmitglied werden und exklusive Vorteile erhalten:
https://www.youtube.com/channe....l/UCZM2U4pbqvSia_-kE
Hat dir das Video gefallen? Zeige es mir mit einem Like!
TWITTER: https://twitter.com/LeoTutorials
INSTAGRAM: https://instagram.com/leo_officetutorials
TIKTOK: https://www.tiktok.com/@leoofficetutorials
LINKEDIN: https://bit.ly/3EdhzEZ
FACEBOOK: https://bit.ly/3Ecqw1t
Abonnieren nicht vergessen ;)
Hast du Fragen? Ab damit in die Kommentare!
Meine Playlist!
Alle Tutorials: https://bit.ly/3bxPVUm
Google Docs: https://bit.ly/2wJq9h1
Google Sheets: https://bit.ly/2vP3gbo
Apps Script: https://bit.ly/3wcRDV8
Google Slides: https://bit.ly/2Jvq6IB
Word Online: https://bit.ly/3aqGB4c
Excel Online: https://bit.ly/3bw0xD6
Power Point Online: https://bit.ly/2KIs6Ry
Word: https://bit.ly/3408AFP
Meine YouTube Shorts: https://bit.ly/3dZgRAv
Word Online: https://www.office.com/launch/word
Excel Online: https://www.office.com/launch/excel
PowerPoint Online: https://www.office.com/launch/powerpoint
Google Docs: https://docs.google.com
Google Sheets: https://sheets.google.com
Google Slides: https://slides.google.com
Für Vorschläge oder Videowünsche schreibt mir bitte auf Instagram.
Intro Musik: Cat Shat in the Box - josh pan
https://www.youtube.com/c/joshpan89
Endcard Musik: JPB & MYRNE - Feels Right (ft. Yung Fusion)
https://www.youtube.com/watch?v=dXYFK-jEr8Y
Kanal: https://youtube.com/Leoofficetutorials
#sheets #tutorial #googlesheets #statistik

Herzlich Willkommen zurück! In diesem Video zeige ich dir ein Update zum gewichteten Mittelwert in Google Sheets. Denn Sheets hat bereits doch eine eingebaute Funktion, um diesen zu berechnen. Die Avarage.Weighted Funktion.
Leo Office Tutorials - Docs - Sheets - Slides - Word - Excel - PowerPoint - Apps Script
Artikel zum Video: https://leoofficetutorials.com..../sheets/statistik/50
Kapitelmarken
0:00 Begrüßung & Intro
0:31 Average.Weighted Funktion
2:40 Fazit & Schluss
Kanalmitglied werden und exklusive Vorteile erhalten:
https://www.youtube.com/channe....l/UCZM2U4pbqvSia_-kE
Hat dir das Video gefallen? Zeige es mir mit einem Like!
TWITTER: https://twitter.com/LeoTutorials
INSTAGRAM: https://instagram.com/leo_officetutorials
TIKTOK: https://www.tiktok.com/@leoofficetutorials
LINKEDIN: https://bit.ly/3EdhzEZ
FACEBOOK: https://bit.ly/3Ecqw1t
Abonnieren nicht vergessen ;)
Hast du Fragen? Ab damit in die Kommentare!
Meine Playlist!
Alle Tutorials: https://bit.ly/3bxPVUm
Google Docs: https://bit.ly/2wJq9h1
Google Sheets: https://bit.ly/2vP3gbo
Apps Script: https://bit.ly/3wcRDV8
Google Slides: https://bit.ly/2Jvq6IB
Word Online: https://bit.ly/3aqGB4c
Excel Online: https://bit.ly/3bw0xD6
Power Point Online: https://bit.ly/2KIs6Ry
Word: https://bit.ly/3408AFP
Meine YouTube Shorts: https://bit.ly/3dZgRAv
Word Online: https://www.office.com/launch/word
Excel Online: https://www.office.com/launch/excel
PowerPoint Online: https://www.office.com/launch/powerpoint
Google Docs: https://docs.google.com
Google Sheets: https://sheets.google.com
Google Slides: https://slides.google.com
Für Vorschläge oder Videowünsche schreibt mir bitte auf Instagram.
Intro Musik: Cat Shat in the Box - josh pan
https://www.youtube.com/c/joshpan89
Endcard Musik: JPB & MYRNE - Feels Right (ft. Yung Fusion)
https://www.youtube.com/watch?v=dXYFK-jEr8Y
Kanal: https://youtube.com/Leoofficetutorials
#tutorial #googlesheets #sheets #statistik

Herzlich Willkommen zurück! In diesem Video zeige ich dir in Google Sheets, wie du die Varianz berechnen kannst.
Leo Office Tutorials - Docs - Sheets - Slides - Word - Excel - PowerPoint - Apps Script
Artikel zum Video: https://leoofficetutorials.com..../sheets/statistik/49
Kapitelmarken
0:00 Begrüßung & Intro
0:25 Varianz Funktion
1:10 Eigene Benannte Funktion
3:30 Warum du die Varianz Funktion von Sheets verwenden solltest
4:10 Fazit & Schluss
Kanalmitglied werden und exklusive Vorteile erhalten:
https://www.youtube.com/channe....l/UCZM2U4pbqvSia_-kE
Hat dir das Video gefallen? Zeige es mir mit einem Like!
TWITTER: https://twitter.com/LeoTutorials
INSTAGRAM: https://instagram.com/leo_officetutorials
TIKTOK: https://www.tiktok.com/@leoofficetutorials
LINKEDIN: https://bit.ly/3EdhzEZ
FACEBOOK: https://bit.ly/3Ecqw1t
Abonnieren nicht vergessen ;)
Hast du Fragen? Ab damit in die Kommentare!
Meine Playlist!
Alle Tutorials: https://bit.ly/3bxPVUm
Google Docs: https://bit.ly/2wJq9h1
Google Sheets: https://bit.ly/2vP3gbo
Apps Script: https://bit.ly/3wcRDV8
Google Slides: https://bit.ly/2Jvq6IB
Word Online: https://bit.ly/3aqGB4c
Excel Online: https://bit.ly/3bw0xD6
Power Point Online: https://bit.ly/2KIs6Ry
Word: https://bit.ly/3408AFP
Meine YouTube Shorts: https://bit.ly/3dZgRAv
Word Online: https://www.office.com/launch/word
Excel Online: https://www.office.com/launch/excel
PowerPoint Online: https://www.office.com/launch/powerpoint
Google Docs: https://docs.google.com
Google Sheets: https://sheets.google.com
Google Slides: https://slides.google.com
Für Vorschläge oder Videowünsche schreibt mir bitte auf Instagram.
Intro Musik: Cat Shat in the Box - josh pan
https://www.youtube.com/c/joshpan89
Endcard Musik: JPB & MYRNE - Feels Right (ft. Yung Fusion)
https://www.youtube.com/watch?v=dXYFK-jEr8Y
Kanal: https://youtube.com/Leoofficetutorials
#tutorial #googlesheets #sheets #statistik

Herzlich Willkommen zurück! In diesem Video zeige ich dir, wie du mit einer Benannten Funktion den euklidischen Abstand zwischen zwei Punkten berechnen kannst.
Leo Office Tutorials - Docs - Sheets - Slides - Word - Excel - PowerPoint - Apps Script
Artikel zum Video: https://leoofficetutorials.com..../sheets/statistik/58
Kapitelmarken
0:00 Begrüßung & Intro
0:36 Einführung
1:40 Formel für euklidischen Abstand
2:50 Benannte Funktionen
3:57 Abstand berechnen
6:10 Fazit & Schluss
Kanalmitglied werden und exklusive Vorteile erhalten:
https://www.youtube.com/channe....l/UCZM2U4pbqvSia_-kE
Hat dir das Video gefallen? Zeige es mir mit einem Like!
TWITTER: https://twitter.com/LeoTutorials
INSTAGRAM: https://instagram.com/leo_officetutorials
TIKTOK: https://www.tiktok.com/@leoofficetutorials
LINKEDIN: https://bit.ly/3EdhzEZ
FACEBOOK: https://bit.ly/3Ecqw1t
Abonnieren nicht vergessen ;)
Hast du Fragen? Ab damit in die Kommentare!
Meine Playlist!
Alle Tutorials: https://bit.ly/3bxPVUm
Google Docs: https://bit.ly/2wJq9h1
Google Sheets: https://bit.ly/2vP3gbo
Apps Script: https://bit.ly/3wcRDV8
Google Slides: https://bit.ly/2Jvq6IB
Word Online: https://bit.ly/3aqGB4c
Excel Online: https://bit.ly/3bw0xD6
Power Point Online: https://bit.ly/2KIs6Ry
Word: https://bit.ly/3408AFP
Meine YouTube Shorts: https://bit.ly/3dZgRAv
Word Online: https://www.office.com/launch/word
Excel Online: https://www.office.com/launch/excel
PowerPoint Online: https://www.office.com/launch/powerpoint
Google Docs: https://docs.google.com
Google Sheets: https://sheets.google.com
Google Slides: https://slides.google.com
Für Vorschläge oder Videowünsche schreibt mir bitte auf Instagram.
Intro Musik: Cat Shat in the Box - josh pan
https://www.youtube.com/c/joshpan89
Endcard Musik: JPB & MYRNE - Feels Right (ft. Yung Fusion)
https://www.youtube.com/watch?v=dXYFK-jEr8Y
Kanal: https://youtube.com/Leoofficetutorials

Herzlich Willkommen zurück! In diesem Video zeige ich dir, wie du den Standardfehler in Google Sheets berechnen kannst.
Leo Office Tutorials - Docs - Sheets - Slides - Word - Excel - PowerPoint - Apps Script
Artikel zum Video: https://leoofficetutorials.com..../sheets/statistik/50
Kapitelmarken
0:00 Begrüßung & Intro
0:30 Standardfehler berechnen
2:00 Benannte Funktion erstellen
3:45 Fazit & Schluss
Kanalmitglied werden und exklusive Vorteile erhalten:
https://www.youtube.com/channe....l/UCZM2U4pbqvSia_-kE
Hat dir das Video gefallen? Zeige es mir mit einem Like!
TWITTER: https://twitter.com/LeoTutorials
INSTAGRAM: https://instagram.com/leo_officetutorials
TIKTOK: https://www.tiktok.com/@leoofficetutorials
LINKEDIN: https://bit.ly/3EdhzEZ
FACEBOOK: https://bit.ly/3Ecqw1t
Abonnieren nicht vergessen ;)
Hast du Fragen? Ab damit in die Kommentare!
Meine Playlist!
Alle Tutorials: https://bit.ly/3bxPVUm
Google Docs: https://bit.ly/2wJq9h1
Google Sheets: https://bit.ly/2vP3gbo
Apps Script: https://bit.ly/3wcRDV8
Google Slides: https://bit.ly/2Jvq6IB
Word Online: https://bit.ly/3aqGB4c
Excel Online: https://bit.ly/3bw0xD6
Power Point Online: https://bit.ly/2KIs6Ry
Word: https://bit.ly/3408AFP
Meine YouTube Shorts: https://bit.ly/3dZgRAv
Word Online: https://www.office.com/launch/word
Excel Online: https://www.office.com/launch/excel
PowerPoint Online: https://www.office.com/launch/powerpoint
Google Docs: https://docs.google.com
Google Sheets: https://sheets.google.com
Google Slides: https://slides.google.com
Für Vorschläge oder Videowünsche schreibt mir bitte auf Instagram.
Intro Musik: Cat Shat in the Box - josh pan
https://www.youtube.com/c/joshpan89
Endcard Musik: JPB & MYRNE - Feels Right (ft. Yung Fusion)
https://www.youtube.com/watch?v=dXYFK-jEr8Y
Kanal: https://youtube.com/Leoofficetutorials
#tutorial #googlesheets #sheets #statistik

Привет друзья! При работе с трафиком на фейсбук иногда случаются ситуации, когда интеграция статистики в облачную эксель таблицу просто необходима. Вот вам небольшая инструкция на эту тему, и буду рад если это кому-то поможет в работе)
Подписывайся на тг канал: https://t.me/+E_n5W6HIn1A3YzVi
Магазин акаунтов из видео:
Yellow web shop: https://yellowweb.shop/?ref=23 (аккаунты и прокси)
Darkstore shop: https://dark.shopping/?p=73774 (аккаунты)
Прокси: https://proxy6.net/ru/?r=337269
Не забудь подписаться на Ютюб канал!

Herzlich Willkommen zurück! In diesem Video zeige ich dir, wie du in Sheets das Geometrische Mittel berechnen kannst. Mit der Geomittel Funktion.
Leo Office Tutorials - Docs - Sheets - Slides - Word - Excel - PowerPoint - Apps Script
Kapitelmarken
0:00 Begrüßung & Intro
0:29 Geometrisches Mittel berechnen
3:17 Geomittel Funktion
3:53 Benannte Funktion erstellen
5:35 Fazit & Schluss
Kanalmitglied werden und exklusive Vorteile erhalten:
https://www.youtube.com/channe....l/UCZM2U4pbqvSia_-kE
Hat dir das Video gefallen? Zeige es mir mit einem Like!
TWITTER: https://twitter.com/LeoTutorials
INSTAGRAM: https://instagram.com/leo_officetutorials
TIKTOK: https://www.tiktok.com/@leoofficetutorials
LINKEDIN: https://bit.ly/3EdhzEZ
FACEBOOK: https://bit.ly/3Ecqw1t
Abonnieren nicht vergessen ;)
Hast du Fragen? Ab damit in die Kommentare!
Meine Playlist!
Alle Tutorials: https://bit.ly/3bxPVUm
Google Docs: https://bit.ly/2wJq9h1
Google Sheets: https://bit.ly/2vP3gbo
Apps Script: https://bit.ly/3wcRDV8
Google Slides: https://bit.ly/2Jvq6IB
Word Online: https://bit.ly/3aqGB4c
Excel Online: https://bit.ly/3bw0xD6
Power Point Online: https://bit.ly/2KIs6Ry
Word: https://bit.ly/3408AFP
Meine YouTube Shorts: https://bit.ly/3dZgRAv
Word Online: https://www.office.com/launch/word
Excel Online: https://www.office.com/launch/excel
PowerPoint Online: https://www.office.com/launch/powerpoint
Google Docs: https://docs.google.com
Google Sheets: https://sheets.google.com
Google Slides: https://slides.google.com
Für Vorschläge oder Videowünsche schreibt mir bitte auf Instagram.
Intro Musik: Cat Shat in the Box - josh pan
https://www.youtube.com/c/joshpan89
Endcard Musik: JPB & MYRNE - Feels Right (ft. Yung Fusion)
https://www.youtube.com/watch?v=dXYFK-jEr8Y
Kanal: https://youtube.com/Leoofficetutorials
#googlesheets #sheets #tutorial #statistik

Herzlich Willkommen zurück! In diesem Video zeige ich dir in Google Sheets, wie du mit der Korrel Funktion den Korrelationskoeffizienten berechnen kannst.
Leo Office Tutorials - Docs - Sheets - Slides - Word - Excel - PowerPoint - Apps Script
Artikel zum Video: https://leoofficetutorials.com..../sheets/statistik/49
Kapitelmarken
0:00 Begrüßung & Intro
0:26 Was ist der Korrelationskoeffizient?
1:20 Korrel Funktion
2:52 Positive Korrelation
3:55 Keine Korrelation
5:01 Fazit & Schluss
Kanalmitglied werden und exklusive Vorteile erhalten:
https://www.youtube.com/channe....l/UCZM2U4pbqvSia_-kE
Hat dir das Video gefallen? Zeige es mir mit einem Like!
TWITTER: https://twitter.com/LeoTutorials
INSTAGRAM: https://instagram.com/leo_officetutorials
TIKTOK: https://www.tiktok.com/@leoofficetutorials
LINKEDIN: https://bit.ly/3EdhzEZ
FACEBOOK: https://bit.ly/3Ecqw1t
Abonnieren nicht vergessen ;)
Hast du Fragen? Ab damit in die Kommentare!
Meine Playlist!
Alle Tutorials: https://bit.ly/3bxPVUm
Google Docs: https://bit.ly/2wJq9h1
Google Sheets: https://bit.ly/2vP3gbo
Apps Script: https://bit.ly/3wcRDV8
Google Slides: https://bit.ly/2Jvq6IB
Word Online: https://bit.ly/3aqGB4c
Excel Online: https://bit.ly/3bw0xD6
Power Point Online: https://bit.ly/2KIs6Ry
Word: https://bit.ly/3408AFP
Meine YouTube Shorts: https://bit.ly/3dZgRAv
Word Online: https://www.office.com/launch/word
Excel Online: https://www.office.com/launch/excel
PowerPoint Online: https://www.office.com/launch/powerpoint
Google Docs: https://docs.google.com
Google Sheets: https://sheets.google.com
Google Slides: https://slides.google.com
Für Vorschläge oder Videowünsche schreibt mir bitte auf Instagram.
Intro Musik: Cat Shat in the Box - josh pan
https://www.youtube.com/c/joshpan89
Endcard Musik: JPB & MYRNE - Feels Right (ft. Yung Fusion)
https://www.youtube.com/watch?v=dXYFK-jEr8Y
Kanal: https://youtube.com/Leoofficetutorials
#tutorial #googlesheets #sheets #statistik

Herzlich Willkommen zurück! In diesem Video zeige ich dir, wie du mithilfe einer Konfusionsmatrix Klassifikationsmodelle bewerten kannst. Dazu berechnet du die Parameter Korrektklassifizierungsrate, Relevanz, Sensitivität und Spezifität in deinen Google Sheets Tabellen.
Leo Office Tutorials - Docs - Sheets - Slides - Word - Excel - PowerPoint - Apps Script
Artikel zum Video: https://leoofficetutorials.com/sheets/2024/586
Kapitelmarken
0:00 Begrüßung & Intro
0:32 Beispiel Klassifikation
1:37 Konfusionsmatrix
4:16 Korrektklassifizierungsrate
4:49 Relevanz
5:26 Sensitivität
6:01 Spezifität
7:38 Fazit & Schluss
Kanalmitglied werden und exklusive Vorteile erhalten:
https://www.youtube.com/channe....l/UCZM2U4pbqvSia_-kE
Hat dir das Video gefallen? Zeige es mir mit einem Like!
TWITTER: https://twitter.com/LeoTutorials
INSTAGRAM: https://instagram.com/leo_officetutorials
TIKTOK: https://www.tiktok.com/@leoofficetutorials
LINKEDIN: https://bit.ly/3EdhzEZ
FACEBOOK: https://bit.ly/3Ecqw1t
Abonnieren nicht vergessen ;)
Hast du Fragen? Ab damit in die Kommentare!
Meine Playlist!
Alle Tutorials: https://bit.ly/3bxPVUm
Google Docs: https://bit.ly/2wJq9h1
Google Sheets: https://bit.ly/2vP3gbo
Apps Script: https://bit.ly/3wcRDV8
Google Slides: https://bit.ly/2Jvq6IB
Word Online: https://bit.ly/3aqGB4c
Excel Online: https://bit.ly/3bw0xD6
Power Point Online: https://bit.ly/2KIs6Ry
Word: https://bit.ly/3408AFP
Meine YouTube Shorts: https://bit.ly/3dZgRAv
Word Online: https://www.office.com/launch/word
Excel Online: https://www.office.com/launch/excel
PowerPoint Online: https://www.office.com/launch/powerpoint
Google Docs: https://docs.google.com
Google Sheets: https://sheets.google.com
Google Slides: https://slides.google.com
Für Vorschläge oder Videowünsche schreibt mir bitte auf Instagram.
Intro Musik: Cat Shat in the Box - josh pan
https://www.youtube.com/c/joshpan89
Endcard Musik: JPB & MYRNE - Feels Right (ft. Yung Fusion)
https://www.youtube.com/watch?v=dXYFK-jEr8Y
Kanal: https://youtube.com/Leoofficetutorials
#tutorial #googlesheets #sheets #statistik
