סרט ואנימציה

Learn More at mathantics.com
Visit http://www.mathantics.com for more Free math videos and additional subscription based content!

Smart and quick Addition

Master division with our easy video tutorials. Learn long division, mental math shortcuts, and simple techniques to solve any division problem quickly.
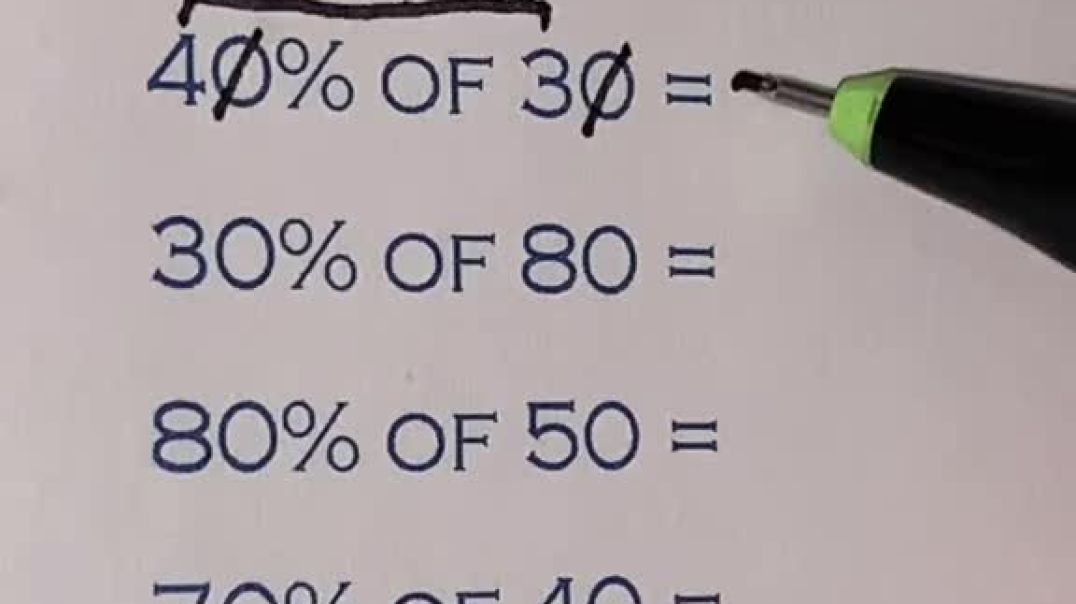
Learn simple math tricks that make calculations effortless. Our free video tutorials cover percentages, multiplication, and more. Master numbers and boost your confidence in minutes!
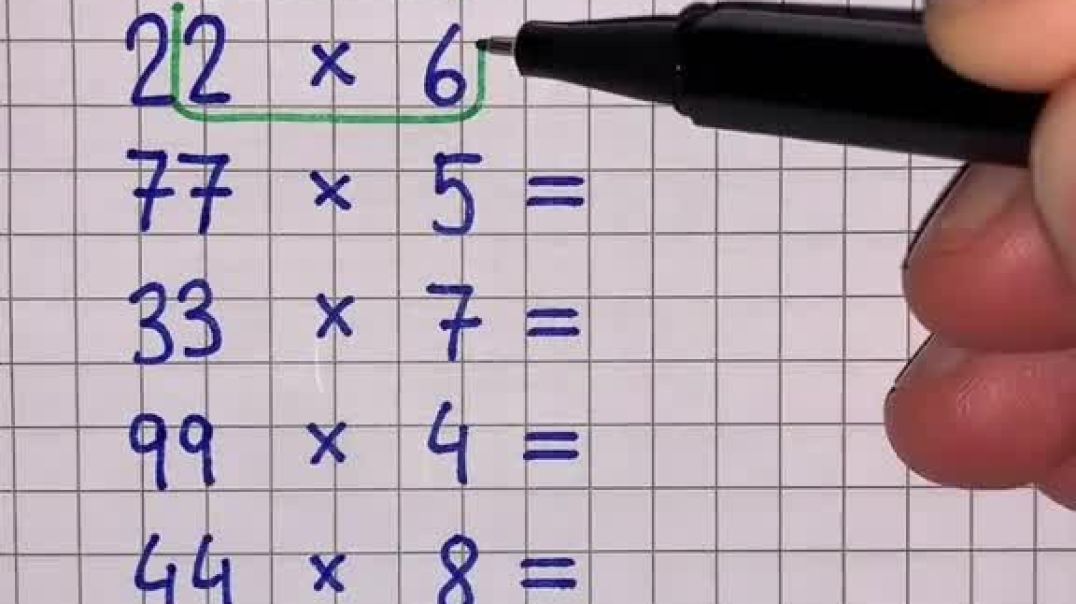
This is a short video that demonstrates a simple and quick mental math trick for multiplying two-digit numbers with identical digits by a single-digit number (e.g., 55 x 3 or 22 x 6).
The method is as follows:
Multiply the repeating digit by the other number in the problem. For example, for 55 x 3, you calculate 5 x 3 = 15.
To find the result, write the number from step 1 twice, like 15 15.
Take the first digit of the first number (1) and place it at the beginning of your answer.
Add the second digit of the first number (5) to the first digit of the second number (1). This gives you the middle digit of your answer (5 + 1 = 6).
Take the second digit of the second number (5) and place it at the end of your answer.
This process quickly gives you the final answer: 165.
The video shows this method with the following examples:
55 x 3 = 165
22 x 6 = 132
77 x 5 = 385
33 x 7 = 231
99 x 4 = 396
44 x 8 = ? (The video does not show the final answer for this problem).
understand.mathematics from Tiktok

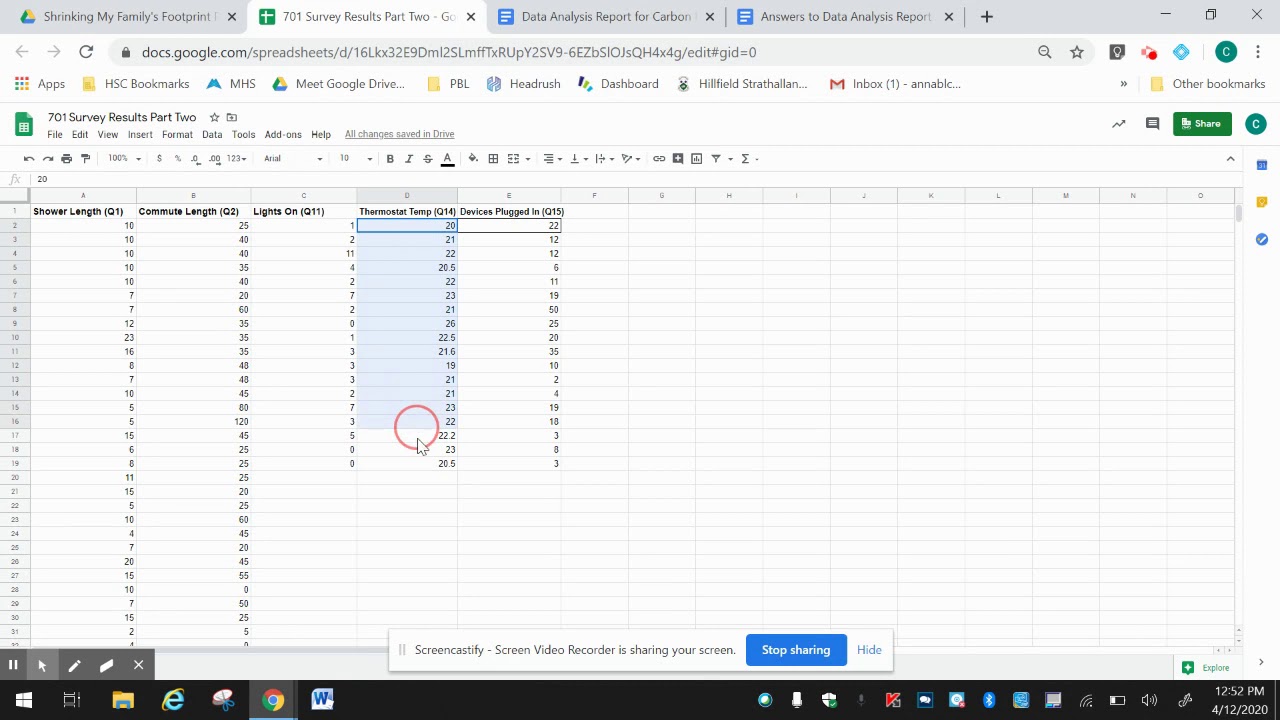
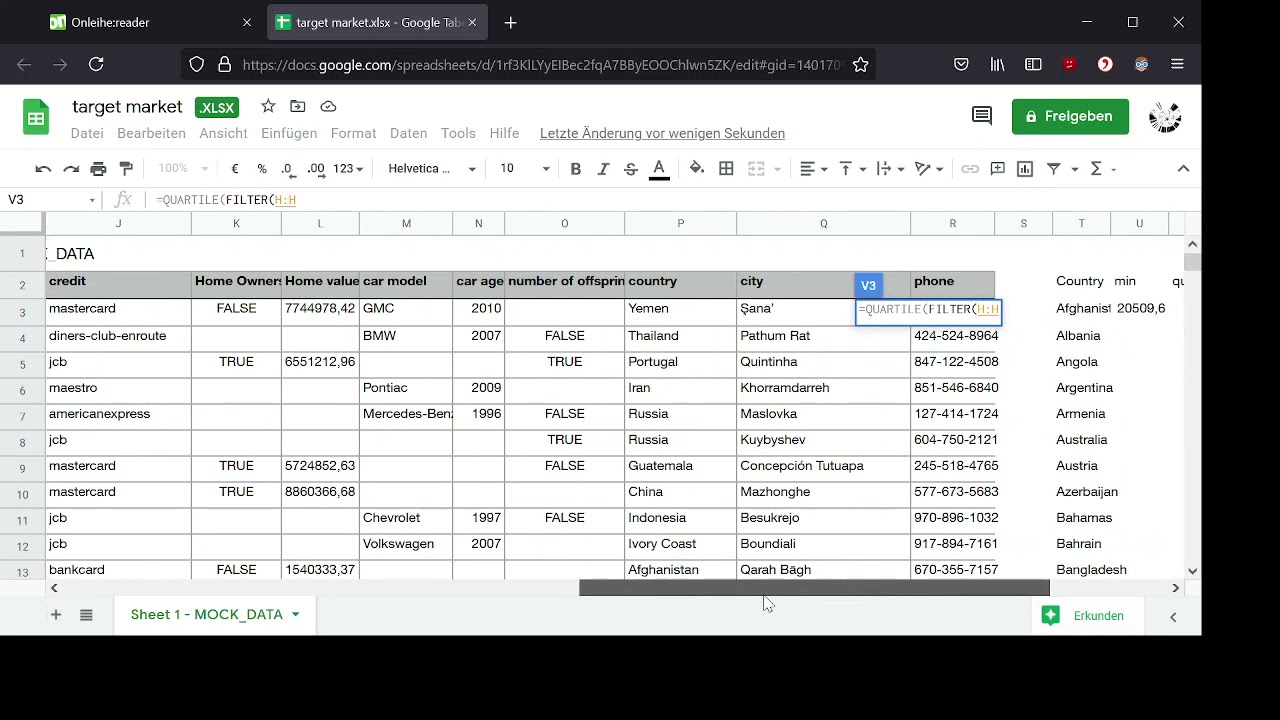
A tutorial on how to create dynamic charts in Google Sheets using the data validation method and vlookup formulas.

Learn how to modify all aspects of your charts in this advanced Google Sheets tutorial. This tutorial covers Data Labels, Legends, Axis Changes, Axis Labels, Secondary Axis, Filter, Multiple Series, Compare Mode, Aggregate Columns & Rows, Gridlines, Trendlines and Much More.

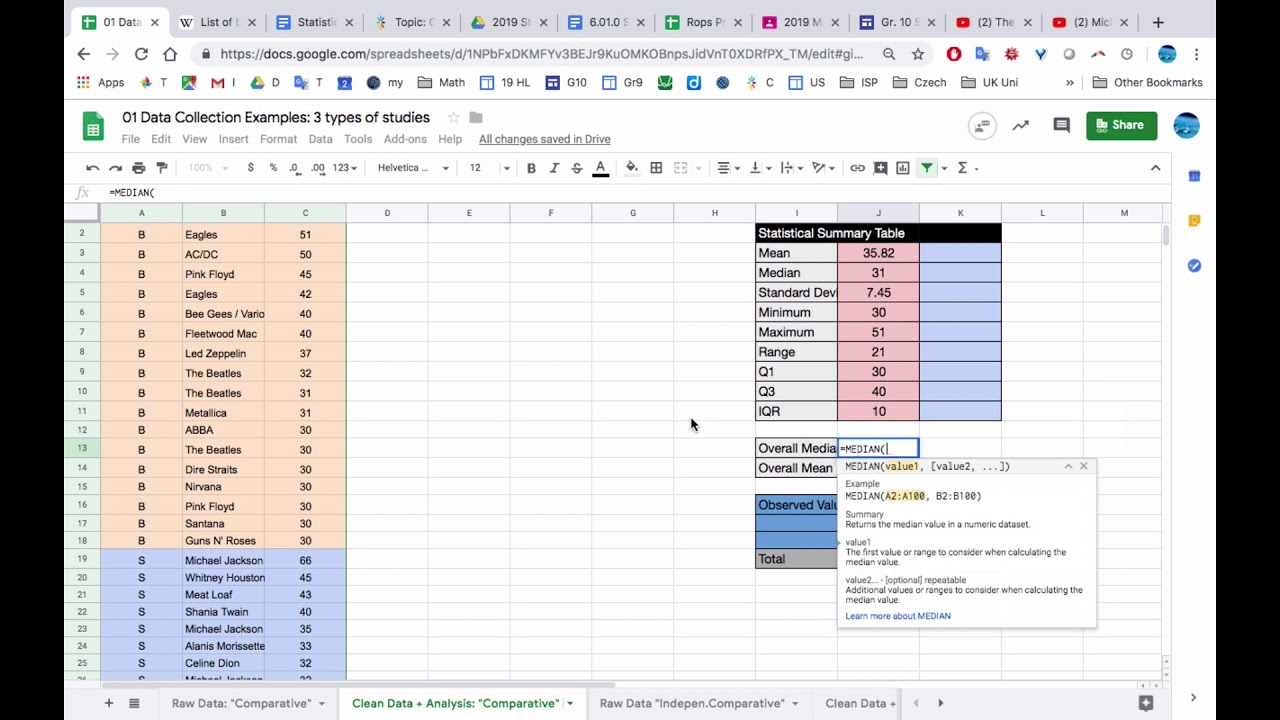
How to calculate 7 descriptive statistics using Google Sheets is demonstrated in this quick video.
The Three Minute Tuesday video series by RILLIAN, a consulting agency, briefly cover topics in approximately 3 minutes or less.
These videos are geared towards anyone working in or interested in work involving Research & Insights Leading to Learning, Innovation, And actioN (R.I.L.L.I.A.N.).
To learn more visit https://www.rillianconsulting.com
Connect with us on LinkedIn: https://www.linkedin.com/company/rillian
#GoogleSheets #descriptivestatistics #dataconsulting #howtocalculatedescriptivestatisticsinGoogleSheets #calculatingthemean #calculatingtheaverage #calculatingthemedian #calculatingthemode #calculatingtherange #calculatingthestandarddeviation #calculatingtheCV #calculatingZscore
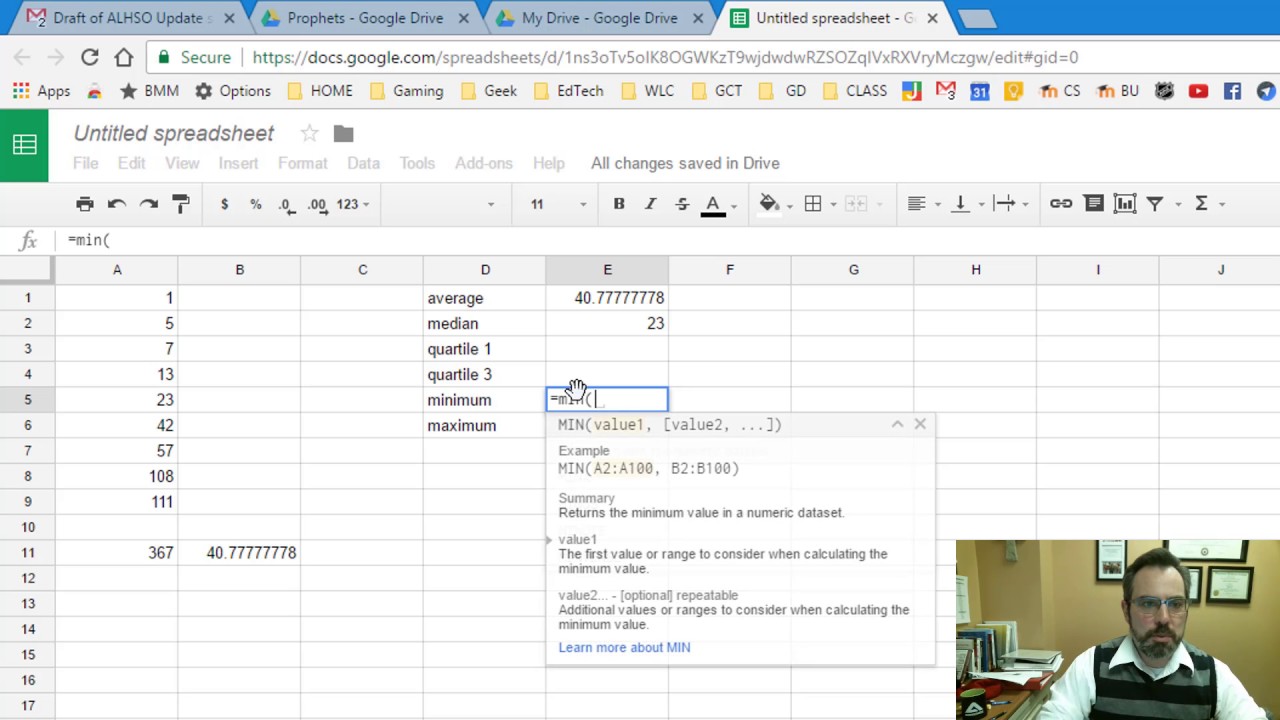

Table of Contents:
00:00 - Introduction
00:08 - Marker 1
Created with TechSmith Snagit for Google Chrome™
http://goo.gl/ySDBPJ

Herzlich Willkommen zurück! In diesem Video zeige ich dir, wie du die Binomialverteilung in Google Sheets berechnen kannst.
Leo Office Tutorials - Docs - Sheets - Slides - Word - Excel - PowerPoint - Apps Script
Kapitelmarken
0:00 Begrüßung & Intro
0:33 Beispieltabelle
2:30 Binomialverteilung
3:11 Kummuliert
4:20 Weitere Beispiele
5:18 Fazit & Schluss
Hat dir das Video gefallen? Zeige es mir mit einem Like!
TWITTER: https://twitter.com/LeoTutorials
INSTAGRAM: https://instagram.com/leo_officetutorials
TIKTOK: https://www.tiktok.com/@leoofficetutorials
LINKEDIN: https://bit.ly/3EdhzEZ
FACEBOOK: https://bit.ly/3Ecqw1t
Abonnieren nicht vergessen ;)
Hast du Fragen? Ab damit in die Kommentare!
Meine Playlist!
Alle Tutorials: https://bit.ly/3bxPVUm
Google Docs: https://bit.ly/2wJq9h1
Google Sheets: https://bit.ly/2vP3gbo
Apps Script: https://bit.ly/3wcRDV8
Google Slides: https://bit.ly/2Jvq6IB
Word Online: https://bit.ly/3aqGB4c
Excel Online: https://bit.ly/3bw0xD6
Power Point Online: https://bit.ly/2KIs6Ry
Word: https://bit.ly/3408AFP
Meine YouTube Shorts: https://bit.ly/3dZgRAv
Word Online: https://www.office.com/launch/word
Excel Online: https://www.office.com/launch/excel
PowerPoint Online: https://www.office.com/launch/powerpoint
Google Docs: https://docs.google.com
Google Sheets: https://sheets.google.com
Google Slides: https://slides.google.com
Für Vorschläge oder Videowünsche schreibt mir bitte auf Instagram.
Intro Musik: Cat Shat in the Box - josh pan
https://www.youtube.com/c/joshpan89
Endcard Musik: JPB & MYRNE - Feels Right (ft. Yung Fusion)
https://www.youtube.com/watch?v=dXYFK-jEr8Y
Kanal: https://youtube.com/Leoofficetutorials
#sheets #googlesheets
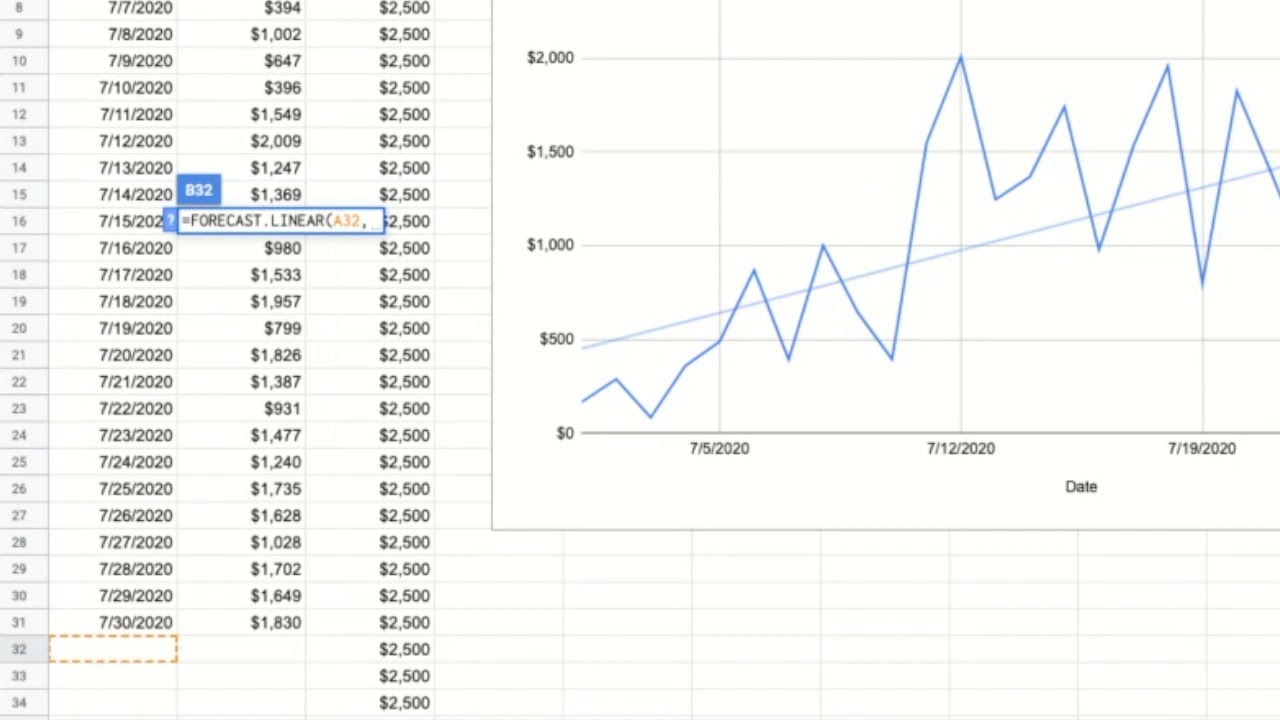
This short video shows you how to add a trend line to a chart in Google Sheets and also how to forecast the date at which you would reach a daily spending goal based on actual historical data.
You can find me on Instagram: https://instagram.com/davidresau
How to add a trendline in google sheets
=FORECAST.LINEAR(Empty Date Cell, Spend Y-Axis, Date X-Axis)
Date, Spend, Goal
If you thought this video was useful, please like, share, and subscribe.
#googlesheets #trendline #forecastfunction

// Liniendiagramm mit 2 Linien in Google Tabellen erstellen //
Zwei Datenreihen abzubilden, die beispielsweise einem zeitlichen Verlauf folgen, funktioniert u.a. mit einem Liniendiagramm. Wie man ein Liniendiagramm mit 2 Linien in Google Tabellen erstellt und formatiert, zeige ich an einem Umsatz/Gewinn-Beispiel.
Bei Fragen und Anregungen zu Liniendiagramm mit 2 Linien in Google Tabellen erstellen, nutzt bitte die Kommentarfunktion. Ob ihr das Video hilfreich fandet, entscheidet ihr mit einem Daumen nach oben oder unten. #statistikampc
⭐Kanalmitglied⭐ werden:
=======================
https://www.youtube.com/channe....l/UCK1rZmGakkss0bvnx
Zeitstempel ⏰
============
0:00 Einleitung und Ausgangssituation
0:15 Daten auswählen
0:28 Diagramm einfügen
0:40 Diagrammtyp ändern
0:55 Diagramm anpassen - Titel
1:09 Diagramm anpassen - Schriftarten und Hintergrundfarbe ändern
1:26 Diagramm anpassen - Linien glätten
1:35 Linien anpassen - Linienart, Deckkraft
2:13 Linien anpassen - Datenpunkte und -labels einfügen und formatieren
3:51 Achsen skalieren
Kanal unterstützen? 🙌🏼
===================
Paypal-Spende: https://www.paypal.com/paypalme/BjoernWalther/5
Amazon Affiliate-Link: http://amzn.to/2iBFeG9
Danke für eure Unterstützung! ♥
Google Sheets - Standard Deviation, Variance, Average Deviation Functions Tutorial Sample,Population
Learn how to calculate Sample & Population Standard Deviation, Variance & Average Deviation in Google Sheets using STDEV, STDEVP, VAR, VARP, AVEDEV Statistical Functions and understand exactly what these functions do.
Google Sheets
https://www.google.com/sheets/about/
Company Page
http://www.chicagocomputerclasses.com/
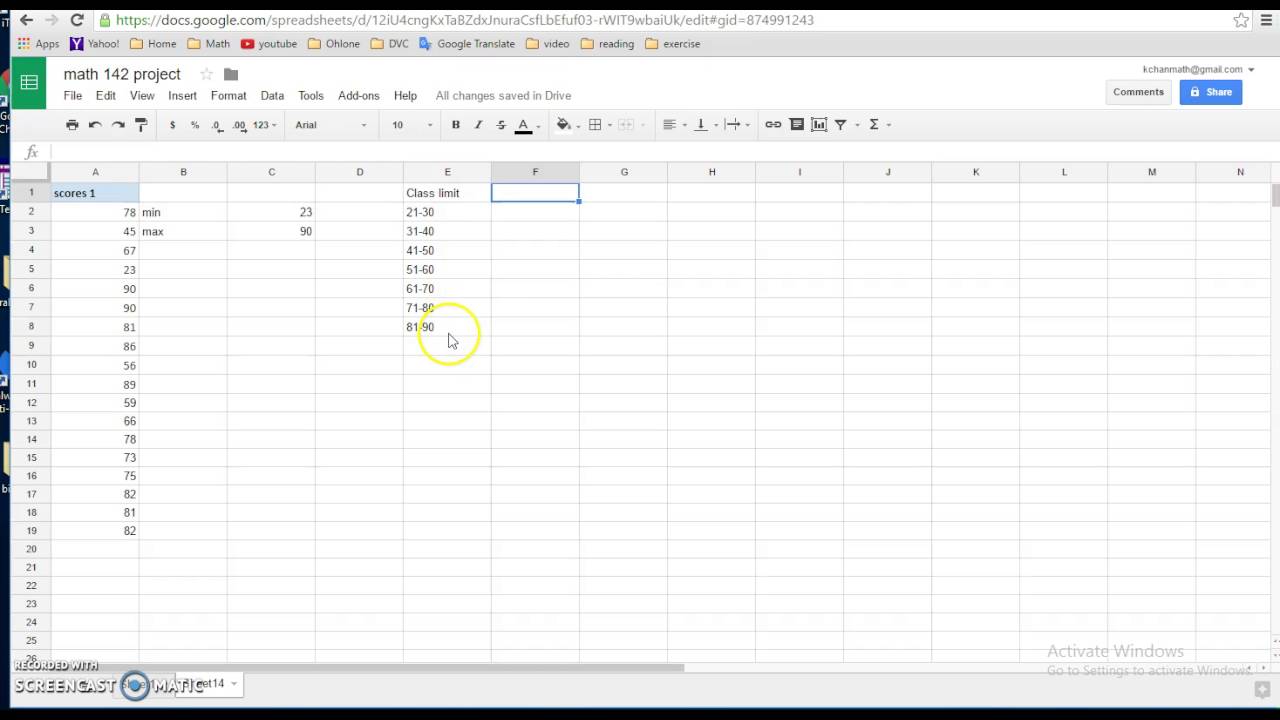

A demonstration of how to use Google Sheets to calcuate basic descriptive statistics for a data set

Combining the INDEX and MATCH functions into one formula gives a powerful function that tops the VLOOKUP function. In this video, I will break this process into three easy steps to build the complete formula.
If you're looking to extract data from a large dataset to summarise your metrics, you will either need the VLOOKUP or the INDEX and MATCH functions.
Check out this introduction video into the VLOOKUP function in Google Sheets https://youtu.be/ZEm6GYsK6lo
I also have this full tutorial on how to return multiple columns using the VLOOKUP Function at Spreadsheet Wise https://bit.ly/multiple-columns-vlookup
Here is a video on returning multiple columns with the VLOOKUP function: https://youtu.be/DxwCv_oCz1Q
You might also like to check out the dropdown chips used in this video here: https://youtu.be/Nw_M_OUgNck
For more videos and/or to subscribe, check out this link
https://www.youtube.com/@spreadsheetwise
Chapters
00:26 - Introduction
00:51 - The three steps of INDEX & MATCH
01:04 - INDEX
01:47 - MATCH Row
02:24 - MATCH Column
02:48 - INDEX & MATCH Combined
04:23 - Dynamic Dropdown Chips with INDEX & MATCH
04:37 - INDEX & MATCH vs VLOOKUP
Social Channels
https://twitter.com/SpreadsheetW
https://www.instagram.com/spreadsheetwise/
https://www.facebook.com/spreadsheetwise/
https://www.pinterest.co.uk/SpreadsheetWise/
#indexmatch #Index #Match #GoogleSheetsVlookup #vlookup #vlookupformula #vlookupfunction #dropdown #dropdownlist #Spreadsheet #GoogleSheetsTipsAndTricks #GoogleSheetsHacks #googlesheets #googlesheetstutorial #Spreadsheetwise

Herzlich Willkommen zurück! In diesem Video zeige ich dir, wie du in Google Sheets den Binomialkoeffizient berechnen kannst.
Leo Office Tutorials - Docs - Sheets - Slides - Word - Excel - PowerPoint - Apps Script
Artikel zum Video: https://leoofficetutorials.com/sheets/2024/587
Kapitelmarken
0:00 Begrüßung & Intro
0:28 Binomialkoeffizient berechnen
1:15 Benannte Funktion erstellen
3:05 COMBINA vs. Kombinationen Funktion
4:30 Fazit & Schluss
Kanalmitglied werden und exklusive Vorteile erhalten:
https://www.youtube.com/channe....l/UCZM2U4pbqvSia_-kE
Hat dir das Video gefallen? Zeige es mir mit einem Like!
TWITTER: https://twitter.com/LeoTutorials
INSTAGRAM: https://instagram.com/leo_officetutorials
TIKTOK: https://www.tiktok.com/@leoofficetutorials
LINKEDIN: https://bit.ly/3EdhzEZ
FACEBOOK: https://bit.ly/3Ecqw1t
Abonnieren nicht vergessen ;)
Hast du Fragen? Ab damit in die Kommentare!
Meine Playlist!
Alle Tutorials: https://bit.ly/3bxPVUm
Google Docs: https://bit.ly/2wJq9h1
Google Sheets: https://bit.ly/2vP3gbo
Apps Script: https://bit.ly/3wcRDV8
Google Slides: https://bit.ly/2Jvq6IB
Word Online: https://bit.ly/3aqGB4c
Excel Online: https://bit.ly/3bw0xD6
Power Point Online: https://bit.ly/2KIs6Ry
Word: https://bit.ly/3408AFP
Meine YouTube Shorts: https://bit.ly/3dZgRAv
Word Online: https://www.office.com/launch/word
Excel Online: https://www.office.com/launch/excel
PowerPoint Online: https://www.office.com/launch/powerpoint
Google Docs: https://docs.google.com
Google Sheets: https://sheets.google.com
Google Slides: https://slides.google.com
Für Vorschläge oder Videowünsche schreibt mir bitte auf Instagram.
Intro Musik: Cat Shat in the Box - josh pan
https://www.youtube.com/c/joshpan89
Endcard Musik: JPB & MYRNE - Feels Right (ft. Yung Fusion)
https://www.youtube.com/watch?v=dXYFK-jEr8Y
Kanal: https://youtube.com/Leoofficetutorials
#tutorial #googlesheets #sheets #statistik

✉️ Join my newsletter
https://steven-bradburn.beehiiv.com/subscribe
In this tutorial, I'll show you how to create a pie chart in Google Sheets. Specifically, how to create a chart with percentage labels. I'll also show you how to modify the appearance of the pie chart, such as changing the labels and pie slice colours. Lastly, I will show you how to export your pie chart as an image.
📖 Video chapters
00:00 Intro
00:24 How to create a pie chart
01:52 Customising the pie chart appearance
03:54 How to export the pie chart (as an image)
04:49 Outro
📺 Other tutorials you will love
Create a pie chart in Excel: https://youtu.be/0WNJkBXywMU
🤝 Connect with me
https://twitter.com/_StevenBradburn
👍 Support me
https://www.buymeacoffee.com/StevenBradburn
Wir haben eine Tabelle aus Rohdaten gegeben, aus denen wir nicht direkt das gewünschte Kerzendiagramm/Box Plot erstellen können.