


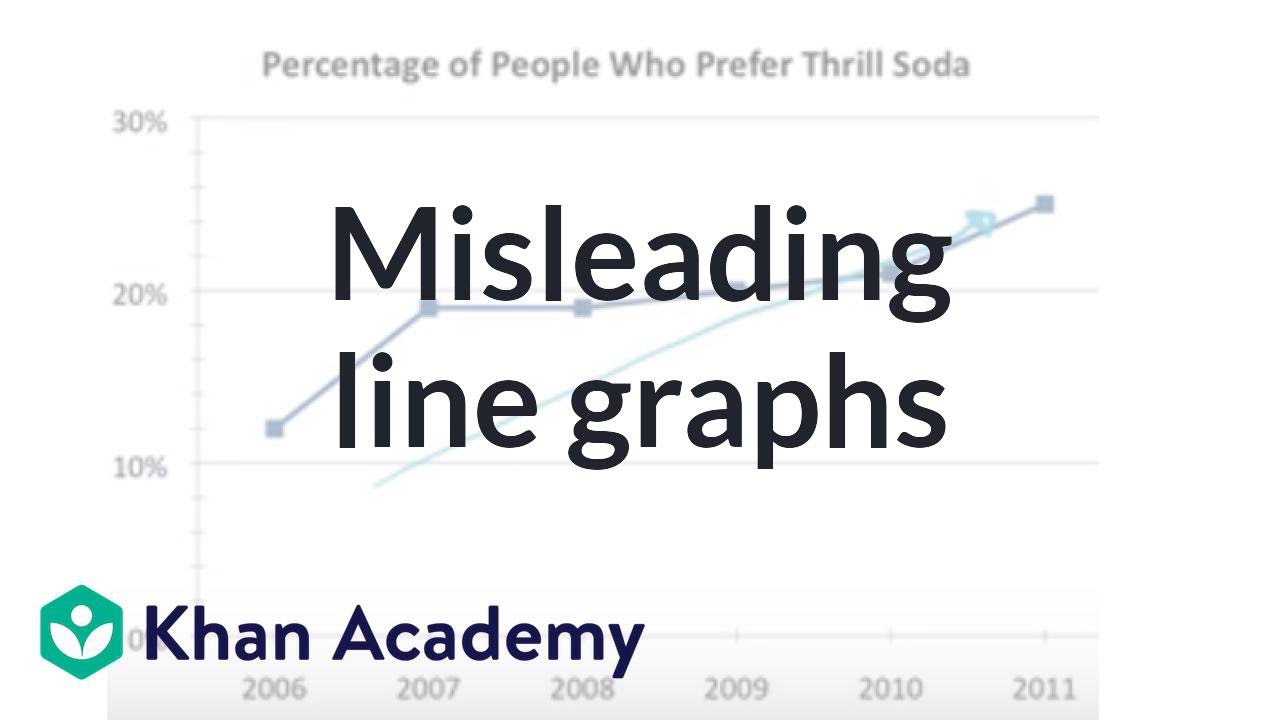


How to use a bar graph and a line graph
4 Visualizzazioni
• 03/17/24
0
0
Incorporare

Teacherflix
5 Iscritti
Learn which type of graph is best four your data. A line graph is helpful for data over time, and a bar graph is helpful for categories. This helps you decide which graph is best for data visualization and which type of graph to use.
Mostra di più

SORT BY-
I migliori commenti
-
Ultimi commenti