סרטונים אחרונים
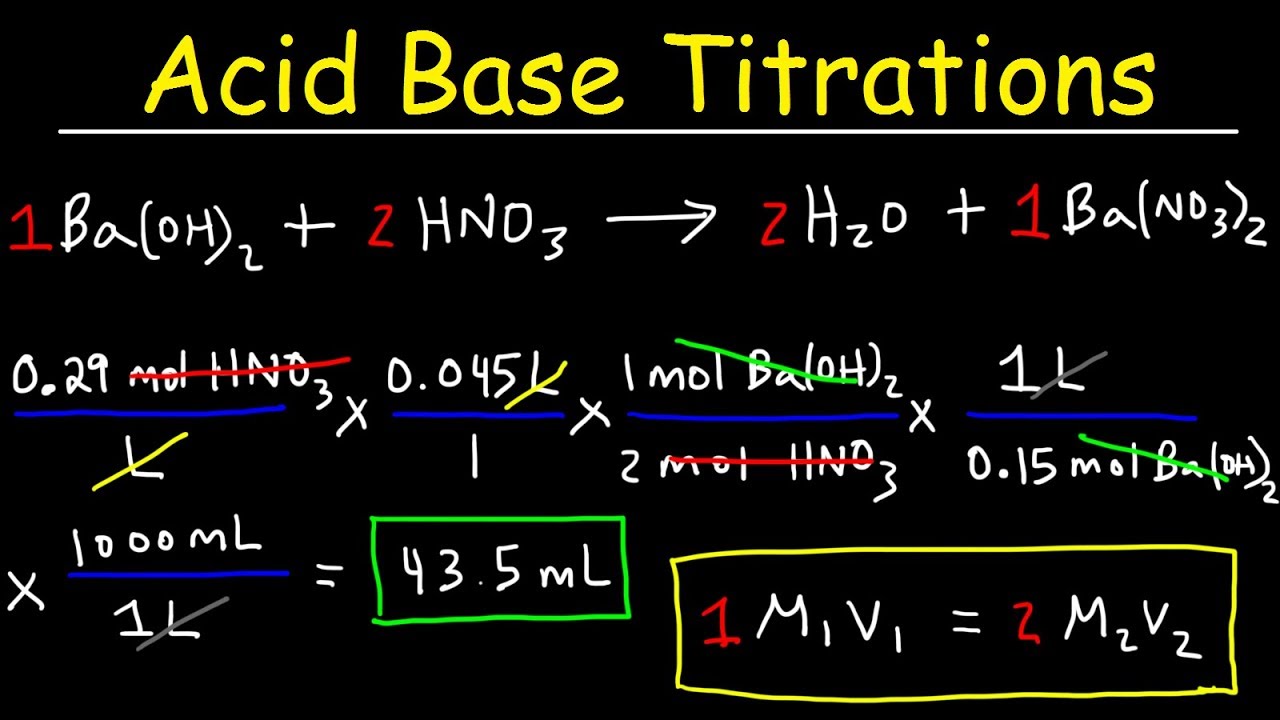
This chemistry video tutorial explains how to solve acid base titration problems. It provides a basic introduction into acid base titrations with the calculations, formulas, & equations that go with it. It explains how to solve acid base titration problems using a formula and a conversion process in typical solution stoichiometry problems. This video contains plenty of examples and practice problems including those with KHP.
Stoichiometry Practice Test:
https://www.youtube.com/watch?v=mP2Yg8alyR0
Solute, Solvent, & Solution:
https://www.youtube.com/watch?v=MDHlaTHbEgM
Strong & Weak Electrolytes:
https://www.youtube.com/watch?v=2U2DBWWo6nc
Molarity Practice Problems:
https://www.youtube.com/watch?v=o_iETsDSvkg
Ion Concentration In Solutions:
https://www.youtube.com/watch?v=H5S4TRAzXhQ
Dilution Problems:
https://www.youtube.com/watch?v=FPidlCmymVg
___________________________________
Types of Chemical Reactions:
https://www.youtube.com/watch?v=iIJD8RNLpS0
Solubility Rules:
https://www.youtube.com/watch?v=LnGIKtx_udE
Predicting The Products of Reactions:
https://www.youtube.com/watch?v=MYmrWHzT1oI
Activity Series of Metals:
https://www.youtube.com/watch?v=VatDpKMJ-BU
Will This Reaction Occur?
https://www.youtube.com/watch?v=ACSKrg2RBmY
Predicting Products of SR Reactions:
https://www.youtube.com/watch?v=s4OFBa7Uans
___________________________________
Double Replacement Reactions:
https://www.youtube.com/watch?v=d8vWIGf2mGE
Net Ionic Equations:
https://www.youtube.com/watch?v=0jhNouV9TNo
Writing Chemical Equations From Words:
https://www.youtube.com/watch?v=npyvZSBqyc0
Solution Stoichiometry:
https://www.youtube.com/watch?v=Ab3wfKjaWWQ
Molarity & Dilution Problems:
https://www.youtube.com/watch?v=-4E6rOkiw2I
Acid Base Neutralization Reactions:
https://www.youtube.com/watch?v=UfTJrAPjeys
____________________________________
Acid Base Titration Problems:
https://www.youtube.com/watch?v=HJvALCcKYAc
Mixture Problems:
https://www.youtube.com/watch?v=e2FAAMlAJ3c
Calculating Oxidation Numbers:
https://www.youtube.com/watch?v=j0hI-a6EWWo
Oxidation and Reduction Reactions:
https://www.youtube.com/watch?v=dF5lB7gRtcA
Balancing Redox Reactions:
https://www.youtube.com/watch?v=fdbrhQAM9Gw
Ideal Gas Law Problems:
https://www.youtube.com/watch?v=iaZ96KaQ44c
___________________________________
Final Exams and Video Playlists:
https://www.video-tutor.net/
Full-Length Videos and Worksheets:
https://www.patreon.com/MathSc....ienceTutor/collectio

This calculus video tutorial explains how to find the indefinite integral of function. It explains how to apply basic integration rules and formulas to help you integrate functions.
Antiderivatives: https://www.youtube.com/watch?v=xaCPDMEkbig
Basic Integration Problems:
https://www.youtube.com/watch?v=zOxaUlRkFG0
Indefinite Integral:
https://www.youtube.com/watch?v=JTFMeSCxgcA
Definite Integral:
https://www.youtube.com/watch?v=Gc3QvUB0PkI
Differential Equations:
https://www.youtube.com/watch?v=H5tD_NtPDuU
_______________________________
Properties of Definite Integrals:
https://www.youtube.com/watch?v=QcHz3h81U-s
Rectilinear Motion Problems:
https://www.youtube.com/watch?v=LBmET4sH460
Sigma Notation - Calculus:
https://www.youtube.com/watch?v=XJkIaw2e1Pw
Riemann Sums - Area:
https://www.youtube.com/watch?v=YTKQswb60Pw
The Midpoint Rule:
https://www.youtube.com/watch?v=5XreKMJDJsg
________________________________
Finding Area - Limit Definition:
https://www.youtube.com/watch?v=ctEpKZyxqFU
Definite Integrals - Geometry:
https://www.youtube.com/watch?v=ghxEOz9rmwE
Fundamental Theorem - Part 1:
https://www.youtube.com/watch?v=aeB5BWY0RlE
Fundamental Theorem - Part 2:
https://www.youtube.com/watch?v=ns8N1UuXl4w
Net Change Theorem:
https://www.youtube.com/watch?v=df1Qr8pepx0
__________________________________
Final Exams and Video Playlists:
https://www.video-tutor.net/
Full-Length Videos and Worksheets:
https://www.patreon.com/MathSc....ienceTutor/collectio
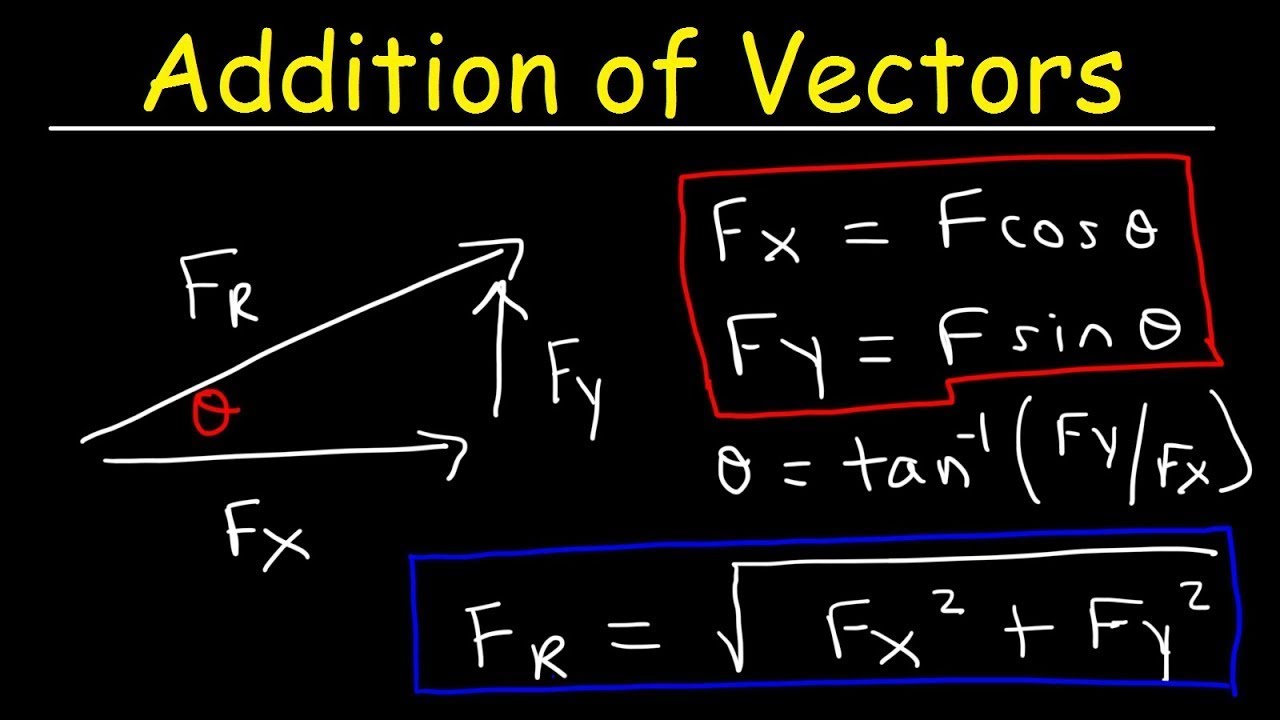
This physics video tutorial focuses on the addition of vectors by means of components analytically. It explains how to find the magnitude and direction of the resultant force vector. This video contains all of the formulas and equations needed to resolve a vector into its components and to use that in order to find the magnitude and direction angle of the resultant force vector. This video explains how to add 2 force vectors to get the resultant sum. This tutorial contains plenty of examples and practice problems.
Full 45 Minute Video on Patreon:
https://www.patreon.com/MathScienceTutor
Direct Link to The Full Video:
https://bit.ly/3GCN1zW
Physics PDF Worksheets:
https://www.video-tutor.net/ph....ysics-basic-introduc
________________________________
Join The Program:
https://bit.ly/46xaQTR
Full Video on YouTube:
https://www.youtube.com/watch?v=UCqj--bKhzo
Addition of Vectors - Notes:
https://www.video-tutor.net/ad....dition-of-vectors.ht
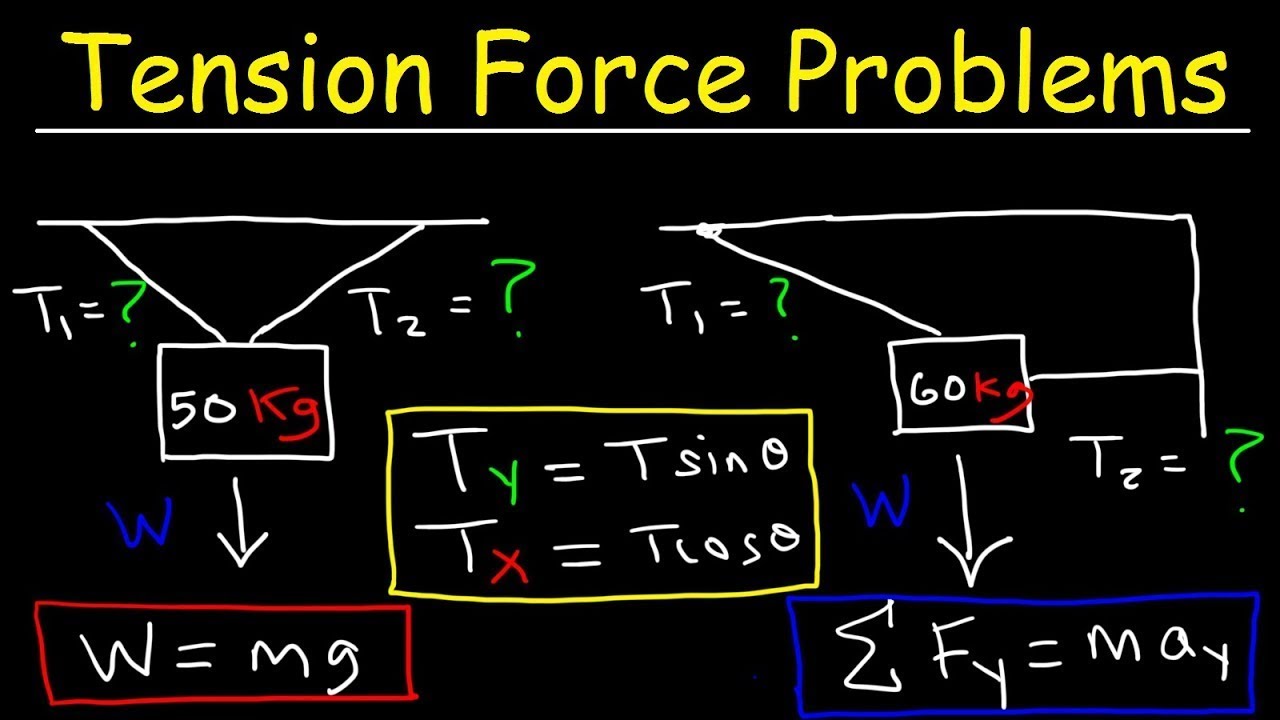
This physics video tutorial explains how to solve tension force problems. It explains how to calculate the tension force in a rope for a object descending with a downward acceleration using newton's laws of motion. it also discusses how to use free body diagrams and the weight force to calculate the tension force in two ropes at different angles. There's another tension force physics problem that asks you to calculate the tension in two cables / ropes where one rope is in the horizontal direction and the second rope is at an angle.
Access The Full 1 Hour Video:
https://www.patreon.com/MathScienceTutor
Direct Link to The Full Video:
https://bit.ly/3vJhW7a
PDF Worksheet - 9 Problems:
https://bit.ly/3CqSIye
Physics PDF Worksheets:
https://www.video-tutor.net/ph....ysics-basic-introduc
________________________________
YouTube Membership:
https://bit.ly/46xaQTR
Full 1 Hour Video on YouTube:
https://www.youtube.com/watch?v=cN3g5rj8o_Q
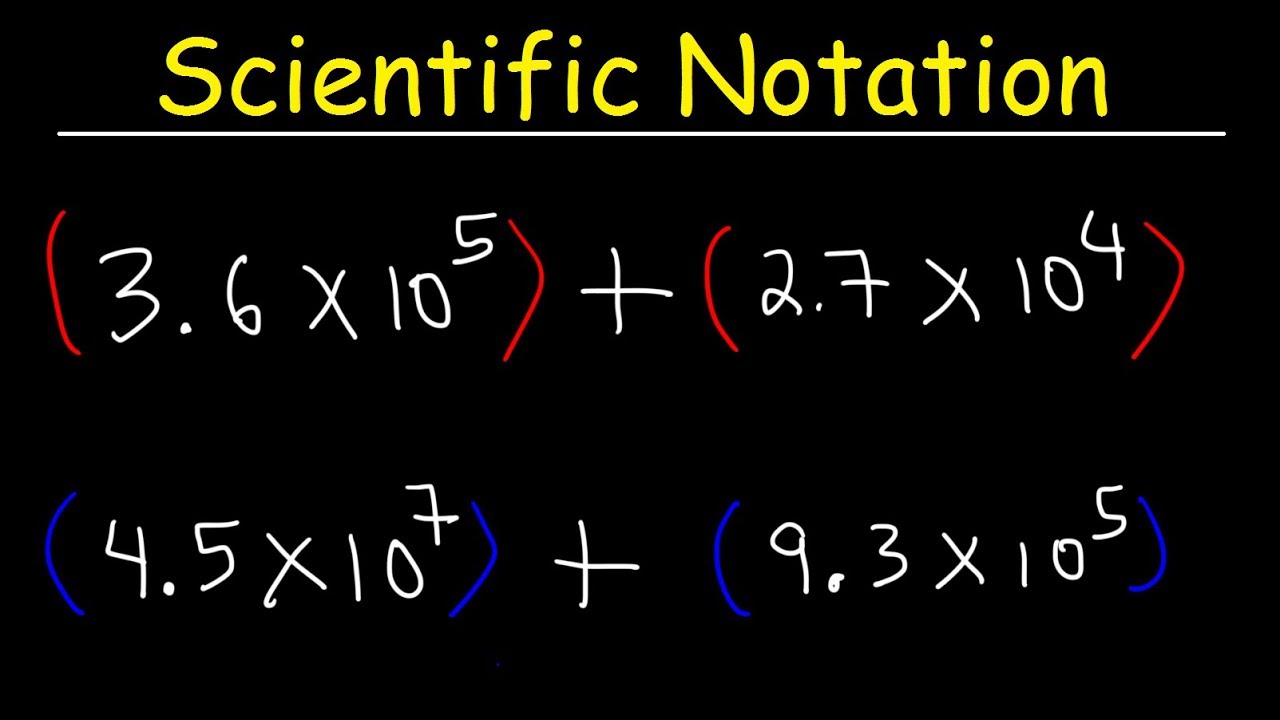
This video provides a basic introduction into scientific notation as it relates to addition and subtraction. It explains how to add and subtract two numbers in scientific notation.
Scientific Notation - A Fast Review: https://www.youtube.com/watch?v=ZtB0vJMGve4
Scientific Notation - Addition & Subtraction:
https://www.youtube.com/watch?v=XHds0Uf1zHA
Scientific Notation - Multiplication & Division:
https://www.youtube.com/watch?v=yX6Mq9whsX0
Scientific Notation - More Example Problems:
https://www.youtube.com/watch?v=_BtzXojuM1o
Scientific Notation - Decimal Square Root:
https://www.youtube.com/watch?v=fK67eDWmtrs
___________________________________
Significant Figures - A Fast Review:
https://www.youtube.com/watch?v=l2yuDvwYq5g
Percent Uncertainty:
https://www.youtube.com/watch?v=b881nOem4vg
Unit Conversion Mega Review:
https://www.youtube.com/watch?v=eK8gXP3pImU
Top 50 Mathematical Symbols:
https://www.youtube.com/watch?v=SkhiZCtegXE
How To Calculate Your GPA:
https://www.youtube.com/watch?v=qYHsThZWydY
___________________________________
General Chemistry - For Beginners:
https://www.youtube.com/watch?v=-KfG8kH-r3Y
Organic Chemistry - Basic Introduction:
https://www.youtube.com/watch?v=B_ketdzJtY8
Physics - Basic Introduction:
https://www.youtube.com/watch?v=b1t41Q3xRM8
Algebra For Beginners:
https://www.youtube.com/watch?v=MHeirBPOI6w
Calculus 1 - Intro to Limits:
https://www.youtube.com/watch?v=YNstP0ESndU
___________________________________
SAT Math Part 1:
https://www.youtube.com/watch?v=fTGuTEQCsZY
ACT Math Test Prep:
https://www.youtube.com/watch?v=SsA7rZ8kczM
GRE Math Test Prep:
https://www.youtube.com/watch?v=z6lbrzaCbdk
Final Exams and Video Playlists:
https://www.video-tutor.net/
Full-Length Videos and Worksheets:
https://www.patreon.com/MathSc....ienceTutor/collectio

This chemistry and physics video tutorial focuses on electromagnetic waves. It shows you how to calculate the wavelength, period, frequency, and amplitude of a wave directly from sinusoidal or sine wave graph. This video contains plenty of notes, equations / formulas, examples, and practice problems.
My E-Book: https://amzn.to/3B9c08z
Video Playlists: https://www.video-tutor.net
Homework Help: https://bit.ly/Find-A-Tutor
Subscribe: https://bit.ly/37WGgXl
Support & Donations: https://www.patreon.com/MathScienceTutor
Youtube Membership: https://www.youtube.com/channe....l/UCEWpbFLzoYGPfuWUM
Here is a list of topics:
1. How to calculate the wavelength of a wave in meters using a graph
2. Inverse relationship of period and frequency
3. Wavelength - the length of a cycle
4. Period is the time it takes a wave to complete a single cycle
5. Frequency is the number of cycles that a wave completes in a single second
6. Units of Frequency - Hz
7. Determining the Amplitude Using the Maximum and Minimum points of a graph.
8. Trough vs Crest of a wave
9. Speed of light Formula of a EM wave in a vacuum and in a material such as water, glass, or diamond
10. Index of refraction, speed of light, and wavelength
11. Frequency of light remains the same
12. Energy of a photon, frequency and planck's constant formula
13. Converting Joules of Energy into Electron Volts eV
14. Electromagnetic Spectrum Chart
15. Infrared, Radio waves, microwaves, roygbiv, ultraviolet UV radiation, x-rays, gamma rays, and cosmic radiation
16. Longest to Shortest Wavelength - Radiowaves to Cosmic Rays
17. EM Spectrum in order of increasing energy and frequency
18. Visible light spectrum wavelength range - color chart diagram - 400nm to 700nm
19. Red, Orange, Yellow, Green, Blue, Indigo, and Violet.
Disclaimer: Some of the links associated with this video may generate affiliate commissions on my behalf. As an amazon associate, I earn from qualifying purchases that you may make through such affiliate links.

This video explains how to calculate the concentration of the solution in forms such as Molarity, Molality, Volume Percent, Mass Percent, and Mole Fraction. It also explains how to calculate the Molarity of the solution given mass percent and density.
Access The Full 1 Hour 20 Minute Video:
https://www.patreon.com/MathScienceTutor
Direct Link to The Full Video on Patreon:
https://bit.ly/3GuiDXd
PDF Worksheet - 17 Practice Problems:
https://bit.ly/3QpptSk
Chemistry PDF Worksheets:
https://www.video-tutor.net/ch....emistry-basic-introd
________________________________________
Full 1 Hour 20 Minute Video on YouTube:
https://www.youtube.com/watch?v=NL8quYmMOMs
Join The YouTube Membership Program:
https://bit.ly/46xaQTR
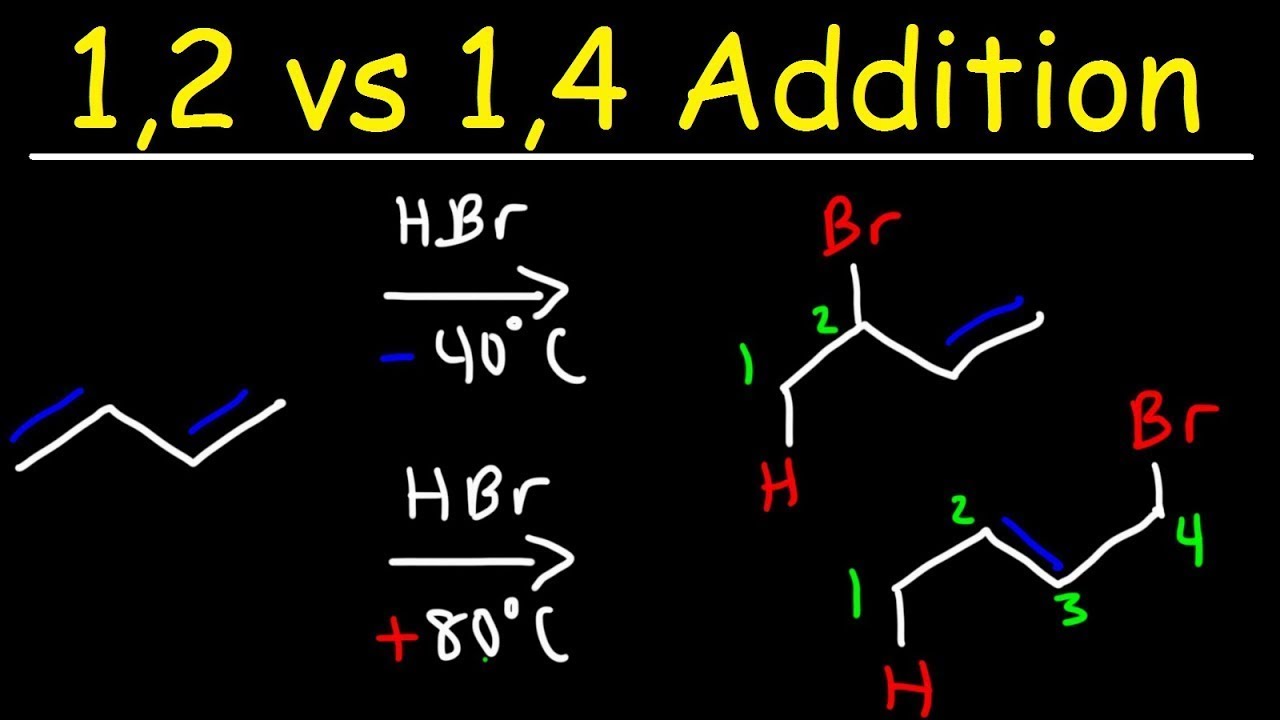
This organic chemistry video tutorial provides a basic introduction into the 1,2 addition reaction and the 1,4 addition of HBr to 1,3-butadiene. The kinetic product is the major product that forms faster at a low temperature. The thermodynamic product is the most stable alkene that forms as the major product at high temperatures.
Access The Full 40 Minute Video on Patreon:
https://www.patreon.com/MathScienceTutor
Direct Link to The Full Video on Patreon:
https://bit.ly/3mwEi8R
Full 40 Minute Video:
https://www.youtube.com/watch?v=BlTDF_7IaBA
Join My Youtube Membership Program:
https://www.youtube.com/channe....l/UCEWpbFLzoYGPfuWUM
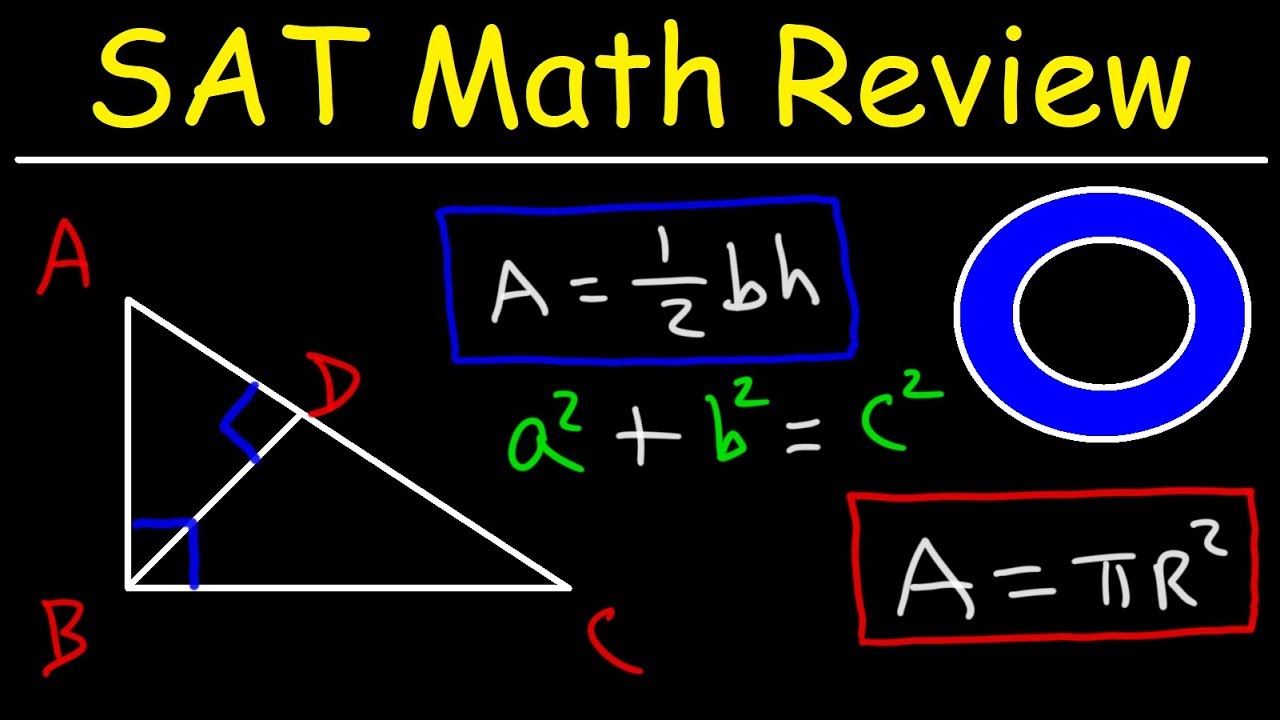
This online sat math test prep review youtube video tutorial will help you to learn the fundamentals behind the main concepts that are routinely covered on the scholastic aptitude test. This online crash course video contains plenty of examples and practice problems for you work on including very hard / difficult math questions with answers and solutions included. There are six main lessons in this study guide that are accompanied by a review of the most important topics, concepts, equations and formulas that you need to do well on the sat. This video contains plenty of multiple choice problems that you can work on as a practice test.
Full 8 Hour SAT Video on Patreon:
https://bit.ly/3sadcH0
Printable PDF With All of The Practice Problems of The Full 8 Hour Video:
https://bit.ly/3hbd1Vy
__________________________
SAT Math Patreon Videos:
https://www.youtube.com/watch?v=C_2lDUO7JK0
Final Exams and Video Playlists:
https://www.video-tutor.net/
Topics include:
1. Evaluating composite functions and algebraic expressions
2. Solving equations and finding the value of x – SAT Math Algebra Review
3. Simplifying Radicals, Exponents, and Factoring Trinomials
4. Solving Equations With Two Variables Using The Substitution and Elimination Method
5. Absolute Value Equations and Multivariable Functions
6. How To Convert Sentences Into Equations to Solve SAT Math Word Problems
7. Word Problems With Averages and Total Sum
8. Consecutive Even / Odd Positive or Negative Integer Word Problem
9. Basketball Team Word Problems – Games won vs Lost
10. Past Present Future Age Word Problem
11. Inclusive vs Exclusive Numbers In a List
12. Distance Rate Time SAT Math Word Problems
13. Ratios and Proportions Based Word Problems
14. Red Green Blue Yellow Marble Probability Problem
15. Nickels Dimes Quarters Word Problem
16. Number of Workers SAT word problem
17. Permutations Combinations and Fundamental Counting Principle
18. Two or Three Digit Integer Word Problem
19. Average Score, Arithmetic Mean, and Weighted Average SAT Math Problem
20. Percent Increase or Decrease Word Problem – Sales Tax vs Discount
21. Original Selling Price and Percent Change Practice Problems
22. Percentage Problems with x and y Variables
23. Slope Calculations, Midpoint and Distance Formula
24. Mean, Median, Mode, and Range
25. Arithmetic and Geometric Series and Sequences Word Problems
26. Linear, Quadratic, and Absolute Value Functions and Graphs
27. SAT Math Geometry Review
28. How to Find the Side Length of a Triangle Given Area and Height
29. How to Calculate the Perimeter of a Triangle Given Hypotenuse
30. How to Determine the Area of a Right Triangle
31. Calculating the Area of a Parallelogram
32. Percent Increase or Decrease of Radius and Height of a Cylinder – Effect on Volume
33. How to Calculate the Perimeter of a Square Given It’s Diagonal
34. Calculating the Altitude of a 45 45 90 degree right triangle
35. Finding the Perimeter of an Equilateral or Equiangular Triangle
36. Calculating the Sum of the Three Remote Exterior Angles of a Triangle
37. Segment Midpoint Geometry Problems
38. Parallel Lines – Corresponding, Alternate Interior, Exterior and Vertical Angles
39. Linear Pairs – Supplementary and Complementary Angles
40. Finding the area of the shaded region of a circle
41. Tangent and Secant Lines on Circles
42. How to Calculate the Arc of a segment of a circle
43. Rectangle Semicircle Word Problem
44. How to Calculate the Perimeter of a Rhombus Given It’s Side Length
45. How to Determine the altitude of a right triangle using the geometric mean and proportions
Disclaimer: Some of the links associated with this video may generate affiliate commissions on my behalf should you decide to make a purchase through such websites.
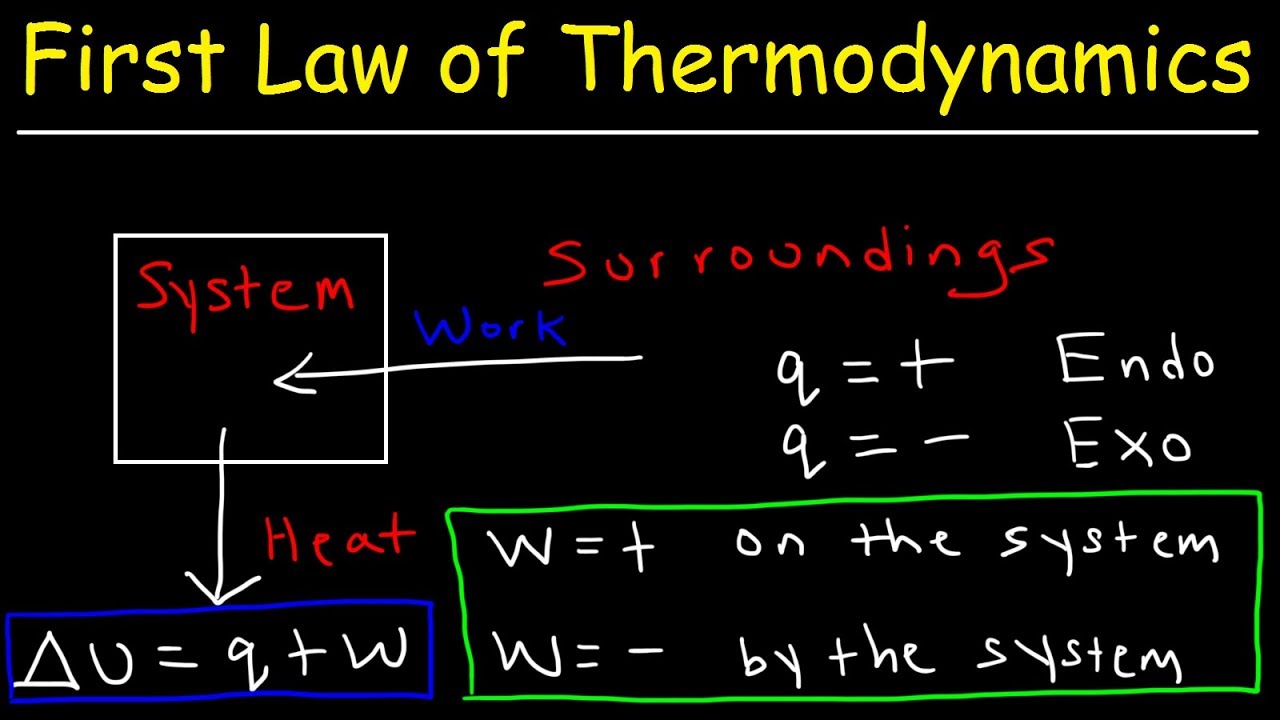
This chemistry video tutorial provides a basic introduction into the first law of thermodynamics. It shows the relationship between internal energy, heat, and work. It discusses the difference between the system and surroundings and distinguishes an open system from a closed system and an isolated system. In chemistry, work is positive whenever work is done on the system and work is negative whenever work is done by the system. During an exothermic process, heat flows out of the system and it flows into the system during an endothermic process.
First Law of Thermodynamics:
https://www.youtube.com/watch?v=NyOYW07-L5g
Thermochemistry Equations:
https://www.youtube.com/watch?v=GL3gCBUua4c
Internal Energy, Heat, and Work:
https://www.youtube.com/watch?v=E7s-hIoyNqY
Thermochemical Equations:
https://www.youtube.com/watch?v=qDrcHR4tSdE
Specific Vs Molar Heat Capacity:
https://www.youtube.com/watch?v=IoHXMaiwT80
________________________________
Basic Calorimetry Problems:
https://www.youtube.com/watch?v=BGcDUybbTW0
Final Temperature Calorimetry Problems:
https://www.youtube.com/watch?v=lxMwyxvSqgk
Latent Heat of Fusion & Vaporization:
https://www.youtube.com/watch?v=dxtz2POUTJE
Coffee Cup Calorimeter:
https://www.youtube.com/watch?v=-XnUypVXE88
More Calorimeter Problems:
https://www.youtube.com/watch?v=F2cMvNDRqQA
__________________________________
Specific Heat Capacity Problems:
https://www.youtube.com/watch?v=ePm_N6RgLfk
Hess Law Problems:
https://www.youtube.com/watch?v=2ixEf2zpR8E
More Hess Law Problems:
https://www.youtube.com/watch?v=Idv2C8HBbug
Enthalpy of Formation & Heat Combustion:
https://www.youtube.com/watch?v=FP-VYfTYi8Y
Enthalpy Practice Problems:
https://www.youtube.com/watch?v=Xe_N7WYl5BI
__________________________________
Speed of Light, Frequency, & Wavelength:
https://www.youtube.com/watch?v=LgYMxH1LCdo
Final Exams and Video Playlists:
https://www.video-tutor.net/
Full-Length Videos and Worksheets:
https://www.patreon.com/MathSc....ienceTutor/collectio
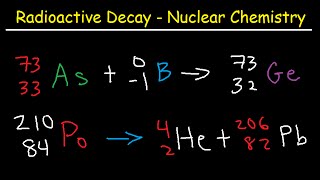
This video tutorial focuses on subatomic particles found in the nucleus of atom such as alpha particles, beta particles, gamma rays, protons, electrons, positrons, and neutrons. It contains plenty of examples and practice problems.
Chemistry PDF Worksheets: https://www.video-tutor.net/ch....emistry-basic-introd
Here is a list of topics:
1. Nuclear Chemistry - Types of Radioactive Decay & Radiation
2. Beta Particle Production / Emission or Beta Decay
3. Conversion of Neutrons Into Protons and Electrons
4. How To Find and Identify The Missing Element
5. Position Production Reaction
6. Gamma Particle Production From The Annihilation of a Positron and an Electron
7. Electron Capture and Nuclear Transformation
8. Alpha Particle Production & Gamma Rays
How To Balance Nuclear Equations: https://www.youtube.com/watch?v=8hnhhBQBQy4
Alpha, Beta, & Gamma Decay: https://www.youtube.com/watch?v=zF5pn8FVlPI
Half Life Chemistry Problems: https://www.youtube.com/watch?v=WTQvfvoOF3g
Carbon-14 Dating Problems: https://www.youtube.com/watch?v=6aDswTVFGfs
Nuclear Binding Energy & Mass Defect: https://www.youtube.com/watch?v=eLwraf_A80U
Nuclear Chemistry & Radioactive Decay: https://www.youtube.com/watch?v=F3NSfTXTl7E
General Chemistry 2 Final Exam Review: https://www.youtube.com/watch?v=lSmJN1_uVpI
______________________________________________________________________________________________
Chemistry - Basic Introduction: https://www.youtube.com/watch?v=-KfG8kH-r3Y
Stoichiometry Practice Problems: https://www.youtube.com/watch?v=mP2Yg8alyR0
Lewis Structures - Mega Review: https://www.youtube.com/watch?v=PeY_sihSh8E
Molarity, Molality, Density, & Mass %: https://www.youtube.com/watch?v=O_nyEj_hZzg
Vapor Pressure & Clausius Equation: https://www.youtube.com/watch?v=xSHDawWK30s
Colligative Properties: https://www.youtube.com/watch?v=c8dDLe37ONg
General Chemistry 1 Final Exam Review: https://www.youtube.com/watch?v=5yw1YH7YA7c
_______________________________________________________________________________________________
Chemical Kinetics - Initial Rate Method: https://www.youtube.com/watch?v=oh4L2gcI5ds
Integrated Rate Laws - 1st & 2nd Order: https://www.youtube.com/watch?v=7I0Xg92_eA4
Chemical Equilibrium & Ice Tables: https://www.youtube.com/watch?v=J4WJCYpTYj8
Acids and Bases - Introduction: https://www.youtube.com/watch?v=FM2MpMbV0rw
Acids and Bases - Practice Test: https://www.youtube.com/watch?v=hmGPK0cuO7o
Ksp - Molar Solubility & Ice Tables: https://www.youtube.com/watch?v=kO-9OajoPZs
Gibbs Free Energy, Entropy & Enthalpy: https://www.youtube.com/watch?v=2KuNzB0cZL4
Entropy - 2nd Law of Thermodynamics: https://www.youtube.com/watch?v=lN66F9V7-_Q
Intro to Galvanic & Voltaic Cells: https://www.youtube.com/watch?v=9blB-uMTIAM
Cell Potential Problems: https://www.youtube.com/watch?v=UzkLP8segcs
Cell Potential & Gibbs Free Energy: https://www.youtube.com/watch?v=LqAfREfwt1Y
Cell Potential & Equilibrium K: https://www.youtube.com/watch?v=n4JCEFJKWA0
Nernst Equation: https://www.youtube.com/watch?v=jousNNceCXs
Electrolysis of Water: https://www.youtube.com/watch?v=zMLNHm4nUCQ
Intro to Electroplating: https://www.youtube.com/watch?v=XnliDNb5ZN4
Electrolysis & Electroplating Problems: https://www.youtube.com/watch?v=DnvKfiLa_HQ
Electrochemistry Practice Problems: https://www.youtube.com/watch?v=S9frctwDyL0
SAT Chemistry Subject Test Review: https://www.youtube.com/watch?v=ygpTfaSFqH8
______________________________________________________________________________________________
Coordinate Covalent Bond: https://www.youtube.com/watch?v=faEYK46zCh4
Complex Ions & Ligands: https://www.youtube.com/watch?v=r4H5XjJPn58
Naming Coordination Compounds: https://www.youtube.com/watch?v=yeNtqjE0dJw
Beer Lambert's Law: https://www.youtube.com/watch?v=rllHziqWlgU
Crystal Field Theory: https://www.youtube.com/watch?v=V1WSesBeURw
_______________________________________________________________________________________________
ACT Math Practice Test: https://www.youtube.com/watch?v=SsA7rZ8kczM

This organic chemistry video tutorial provides a basic introduction into carbohydrates. It explains how to convert the fischer projection of glucose into the haworth projection and the chair conformation.
A Fun Board Game That Teaches You Useful Financial Skills:
https://amzn.to/3F8cBwp
E-book: How To Pass Difficult Math and Science Classes:
https://www.video-tutor.net
Here is a list of topics:
1. Intro to Carbohydrates
2. Monosaccharides - Glucose, Fructose, & Galactose
3. Disaccharides - Sucrose, Maltose, and Lactose
4. Polysaccharides - Starch & Cellulose
5. Fischer Projection of D-Glucose and D-Fructose
6. D and L notations of sugars
7. Epimers - Glucose and Galactose
8. Aldohexoses vs Ketohexoses
9. Fischer Projection to Haworth Projection
10. Anomers - Alpha D-Glucose vs Beta D-Glucose
11. Haworth Projection to Chair Conformation of Glucose
New Organic Chemistry Playlist
https://www.youtube.com/watch?v=6unef5Hz6SU&index=1&list=PL0o_zxa4K1BXP7TUO7656wg0uF1xYnwgm&t=0s
Disclaimer: Some of the links associated with this video may generate affiliate commissions on my behalf. As an amazon associate, I earn from qualifying purchases that you may make through such affiliate links.
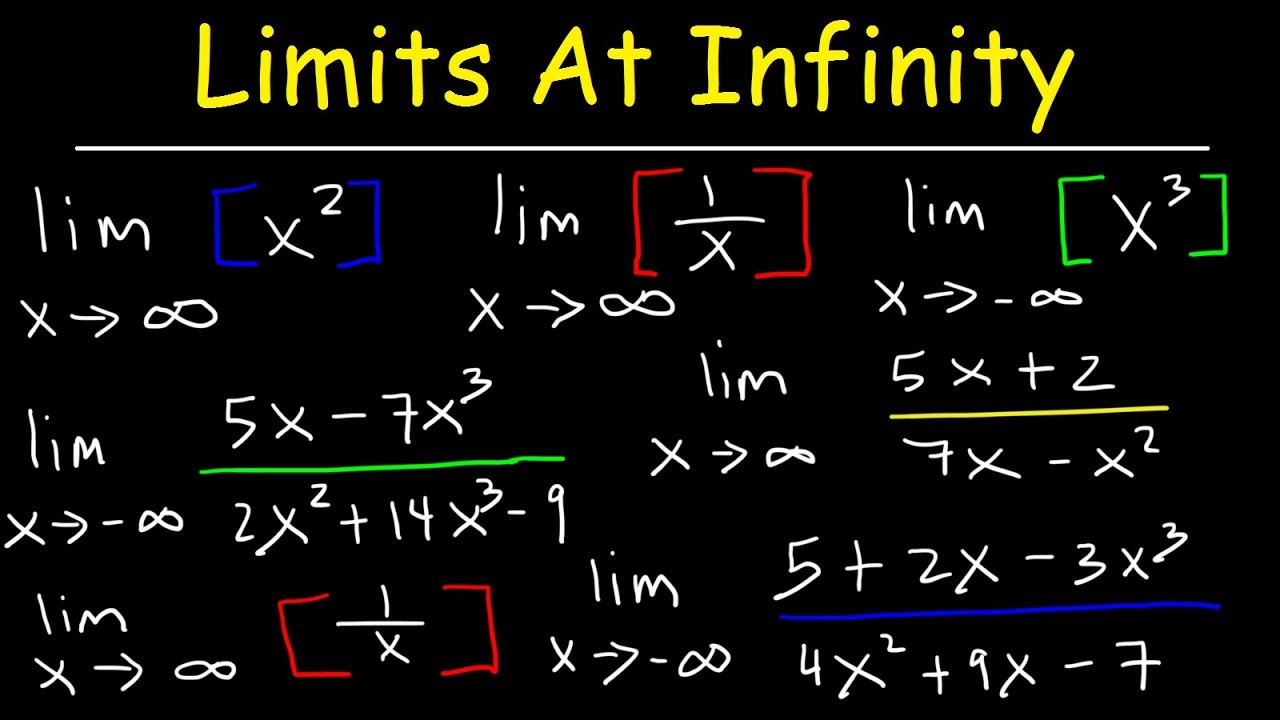
This calculus video tutorial explains how to find the limit at infinity. It covers polynomial functions and rational functions. The limit approaches zero if the function is heavy at the bottom or if the degree of the denominator exceeds that of the numerator. The limit approaches a constant value if the degree of the numerator and the denominator is the same. If the numerator has a higher degree, the limit will approach positive or negative infinity.
Introduction to Limits:
https://www.youtube.com/watch?v=YNstP0ESndU
How To Evaluate Limits From a Graph:
https://www.youtube.com/watch?v=7Q2HwTHcxA0
Evaluating Limits By Factoring:
https://www.youtube.com/watch?v=fOrOeZA-vdY
Limits of Rational Functions :
https://www.youtube.com/watch?v=M2BgBG2Su94
Limits of Radical Functions:
https://www.youtube.com/watch?v=qay5HvT1UK8
Limits of Trigonometric Functions:
https://www.youtube.com/watch?v=HbtuSC_WOW0
___________________________________
How To Find The Limit at Infinity:
https://www.youtube.com/watch?v=NmLljBAg82o
Infinite Limits + Vertical Asymptotes:
https://www.youtube.com/watch?v=xvFqomOpLrs
Limits at Infinity With Radicals:
https://www.youtube.com/watch?v=1hyoTeWg6Bs
Limits of Absolute Value Functions:
https://www.youtube.com/watch?v=wFeh4ByT0xs
Limits of Composite Functions:
https://www.youtube.com/watch?v=KjL9cWHzeIc
The Squeeze Theorem:
https://www.youtube.com/watch?v=lVIb9iJ-rRI
____________________________________
Limits and Logarithms:
https://www.youtube.com/watch?v=fHzmQmcvheI
Limits of Exponential Functions:
https://www.youtube.com/watch?v=pcUXo7XbRaM
Piecewise Functions - Limits:
https://www.youtube.com/watch?v=JrYmEo6hoiU
3 Step Continuity Test:
https://www.youtube.com/watch?v=WT7oxiiFYt8
Continuity and Differentiability:
https://www.youtube.com/watch?v=fml0-ELYLaE
Limits - Test Review:
https://www.youtube.com/watch?v=6e4Wtgc43KQ
_____________________________________
Final Exams and Video Playlists:
https://www.video-tutor.net/
Full-Length Videos and Worksheets:
https://www.patreon.com/MathSc....ienceTutor/collectio
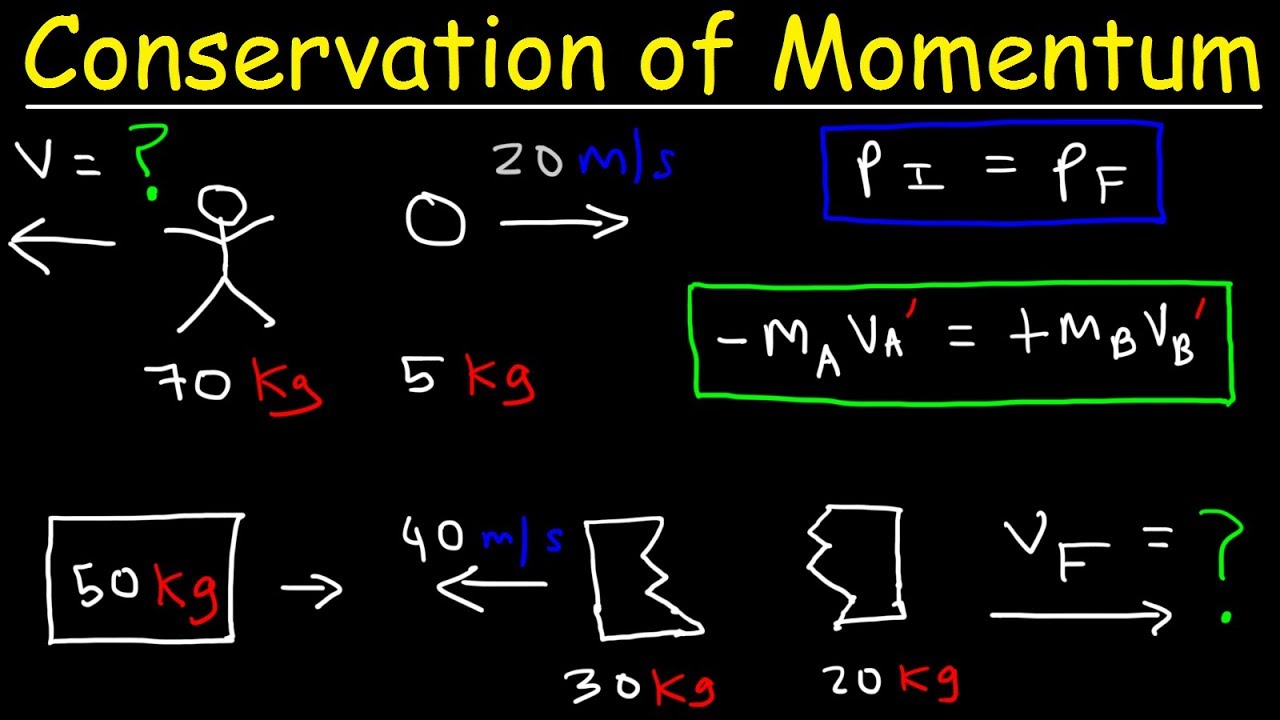
This physics video tutorial provides a basic introduction into solving common conservation of momentum problems. It explains how to find the final speed of an astronaut after throwing a ball in space. It also explains how to calculate the velocity of an object after breaking apart into two smaller fragments. In addition, this video contains an example that asks you to calculate the final speed of a railroad car after a load is dropped vertically into it.
Impulse and Momentum:
https://www.youtube.com/watch?v=hODlmGK7pl8
Rocket Propulsion:
https://www.youtube.com/watch?v=kvAf-Xouj8s
What Really Is a Force?
https://www.youtube.com/watch?v=mril0zFVJXQ
Inelastic Collisions:
https://www.youtube.com/watch?v=C1XuwHLacao
Impulse Momentum Theorem:
https://www.youtube.com/watch?v=1WIECGg71WY
____________________________
Force-Time Graphs:
https://www.youtube.com/watch?v=Bv9ry123zck
Ballistic Pendulum Problem:
https://www.youtube.com/watch?v=PUNKqLkELbQ
Elastic Collisions:
https://www.youtube.com/watch?v=CFbo_nBdBco
2D Collision Problems:
https://www.youtube.com/watch?v=9YRgHikdcqs
Impulse & Momentum Test Review:
https://www.youtube.com/watch?v=FfaEbqmvKQA
_____________________________
Center of Mass Problems:
https://www.youtube.com/watch?v=2uszSnvzBEU
Center of Mass - Calculus:
https://www.youtube.com/watch?v=SWu_i-19Rn0
Intro to Rotational Motion:
https://www.youtube.com/watch?v=WQ9AH2S8B6Y
Full-Length Videos and Worksheets:
https://www.patreon.com/MathSc....ienceTutor/collectio
Physics PDF Worksheets:
https://www.video-tutor.net/ph....ysics-basic-introduc

This calculus 2 video tutorial provides a basic introduction into series. It explains how to determine the convergence and divergence of a series. It explains the difference between a sequence and a series. This video includes examples and practice problems with geometric series, harmonic series, and the telescoping series. It also discusses the divergence test.
Get The Full 50 Minute Video on Patreon:
https://www.patreon.com/MathScienceTutor
Direct Link to The Full Video:
https://bit.ly/3BR6IPm
Full 50 Minute Video on Youtube:
https://www.youtube.com/watch?v=Bz8N2qcghBQ
Join The Membership Program:
https://www.youtube.com/channe....l/UCEWpbFLzoYGPfuWUM
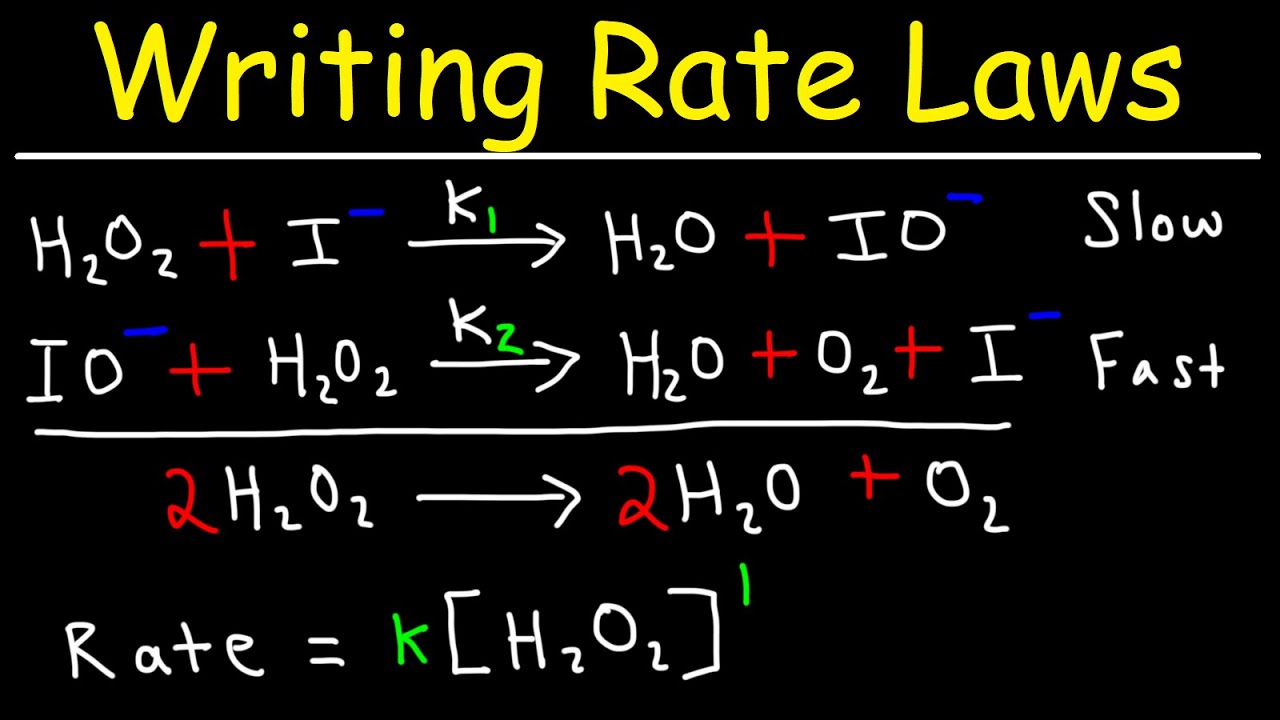
This chemistry video tutorial provides a basic introduction into reaction mechanisms within a chemical kinetics setting. It explains how to write the rate law expression for a reaction mechanism. A reaction mechanism consist of a series of elementary steps or elementary reactions whose rate law can be written from its molecularity - that is from the coefficients of the balanced reaction. The rate of a reaction mechanism is completely dependent on the slow step or the rate-determining step. This video explains how to substitute an intermediate when writing rate law expressions. It contains plenty of examples and practice problems.
Access The Full 53 Minute Video:
https://www.patreon.com/MathScienceTutor
Direct Link to The Full Video:
https://bit.ly/3vPPUad
PDF Worksheet - 6 Questions:
https://bit.ly/3k1riZJ
Chemistry PDF Worksheets:
https://www.video-tutor.net/ch....emistry-basic-introd
_________________________________
Full 53 Minute Video on YouTube:
https://www.youtube.com/watch?v=JC3HmyJ8rts
Join The YouTube Membership Program:
https://bit.ly/46xaQTR
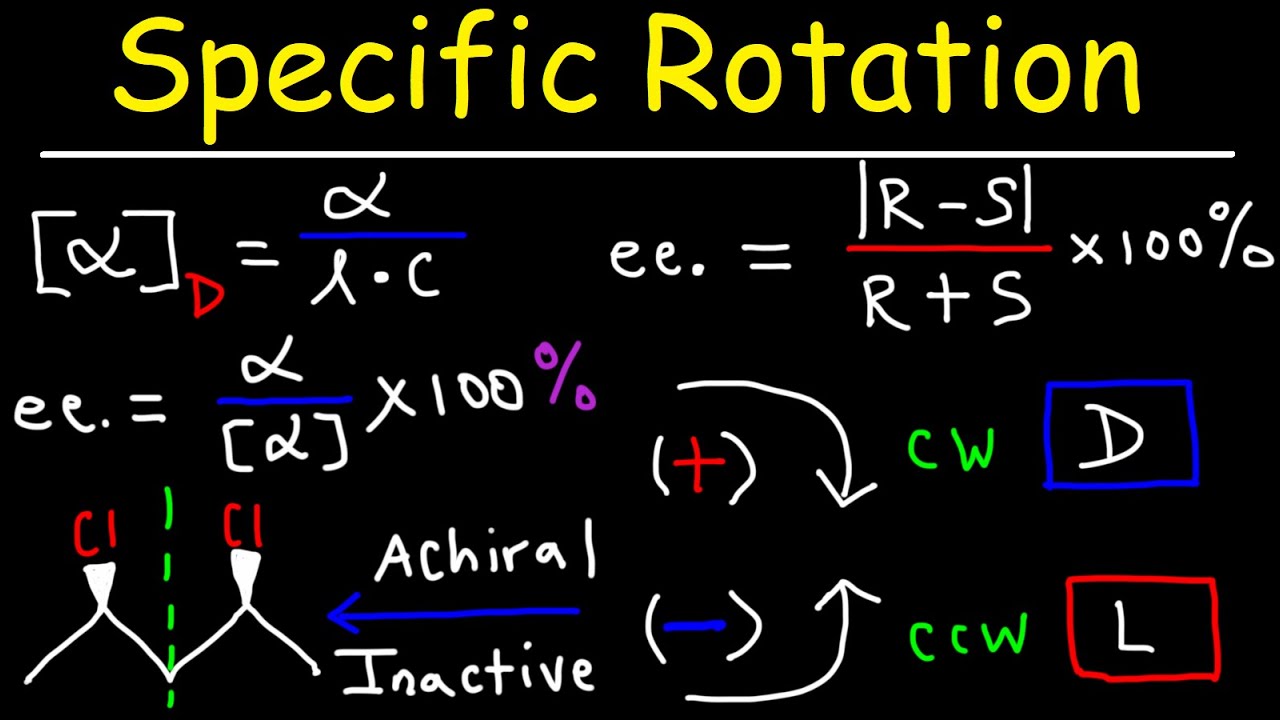
This organic chemistry video tutorial explains how to calculate the specific rotation of an enantiomer given the observed rotation, the pathlength, and the concentration of the solution. It discusses how to determine if a molecule will show optical activity based on its chirality. It also provides the formulas needed to calculate the optical purity and enantiomeric excess. Those formulas can be used to calculate the relative percentages of the R and S isomers.
Access The Full 1 Hour Video on Patreon:
https://www.patreon.com/MathScienceTutor
Direct Link to The Full Video on Patreon:
https://bit.ly/38sWGqY
PDF Worksheet - 10 Practice Problems:
https://bit.ly/3GNhev1
Organic Chemistry PDF Worksheets:
https://www.video-tutor.net/orgo-chem.html
________________________________________
Join The YouTube Membership Program:
https://bit.ly/46xaQTR
Full 1 Hour Video on YouTube:
https://www.youtube.com/watch?v=CHf-9_r4G9U
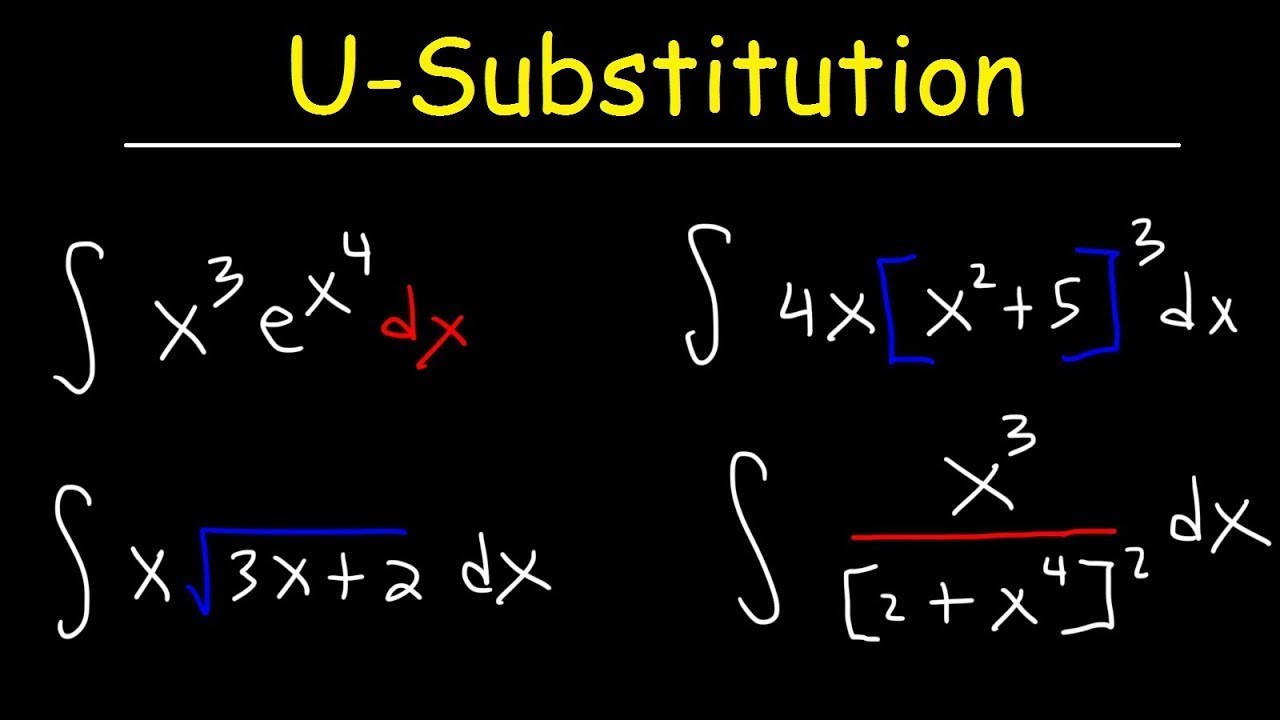
This calculus video tutorial provides a basic introduction into u-substitution. It explains how to integrate using u-substitution. You need to determine which part of the function to set equal to the u variable and you to find the derivative of u to get du and solve for dx. After replacing all x variables with u variables, find the antiderivative of f(u) and substitute u in the new function with x variables. This video contains plenty of examples and practice problems of finding the indefinite integral using u-substitution. Examples include polynomial functions, trigonometric functions, exponential functions, square root functions, and rational functions.
Full 1 Hour 14 Minute Video:
https://www.patreon.com/MathScienceTutor
Direct Link to The Full Video:
https://bit.ly/3BsnALS
__________________________________
Full 1 Hour 14 Minute Video:
https://www.youtube.com/watch?v=htHmjdjwhgQ
Join The Membership Program:
https://bit.ly/46xaQTR
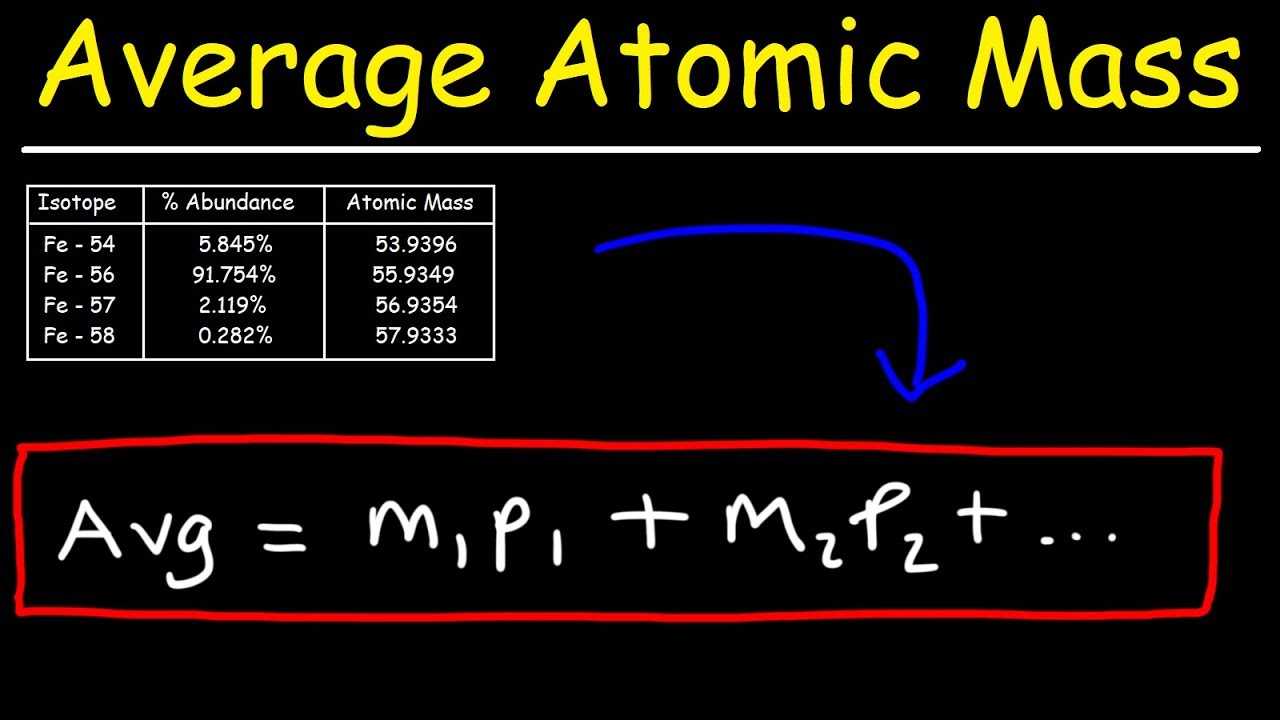
This chemistry video tutorial explains how to calculate the average atomic mass of an element given the percent abundance of each isotope.
Chemistry - Basic Introduction: https://www.youtube.com/watch?v=-KfG8kH-r3Y
Significant Figures Review:
https://www.youtube.com/watch?v=l2yuDvwYq5g
Unit Conversion Problems:
https://www.youtube.com/watch?v=eK8gXP3pImU
Pure Substances & Mixtures:
https://www.youtube.com/watch?v=OHhnm2p5G3o
Physical and Chemical Changes:
https://www.youtube.com/watch?v=YE2xaMsoGFU
_________________________________
Atoms - Basic Introduction:
https://www.youtube.com/watch?v=acdkMeEKCNQ
Cations and Anions Explained:
https://www.youtube.com/watch?v=aAV2DMAI5f8
Diatomic Elements & Molecules:
https://www.youtube.com/watch?v=gi337Mx7wTc
Elements, Atoms, & Molecules:
https://www.youtube.com/watch?v=pSJeMJaCkVU
Protons, Neutrons, & Electrons:
https://www.youtube.com/watch?v=65dDZulPhtg
__________________________________
Average Atomic Mass:
https://www.youtube.com/watch?v=JT18bDAadQ0
What Are Isotopes?
https://www.youtube.com/watch?v=bagegEZBtOs
Percent Abundance of Isotopes:
https://www.youtube.com/watch?v=w-WhwWNC8-Q
Ionic and Covalent Bonding:
https://www.youtube.com/watch?v=uDFLHTDJ4XA
Naming Molecular Compounds:
https://www.youtube.com/watch?v=3agUL7-ezXk
Writing Formulas - Ionic Compounds:
https://www.youtube.com/watch?v=GJ4Mds0CWLE
__________________________________
Final Exams and Video Playlists:
https://www.video-tutor.net/
Full-Length Videos and Worksheets:
https://www.patreon.com/MathSc....ienceTutor/collectio

This video tutorial provides the formulas and equations needed to solve common projectile motion physics problems. It provides an introduction into the three types of graphs / trajectories that you will see in a typical projectile motion problem.
Full 1 Hour 18 Minute Video:
https://www.patreon.com/MathScienceTutor
Direct Link to The Full Video:
https://bit.ly/3WWnzL4
PDF Worksheet - 13 Questions:
https://bit.ly/3QgFMRo
Physics PDF Worksheets:
https://www.video-tutor.net/ph....ysics-basic-introduc

This chemistry video explains the subatomic particles found inside an atom such as protons, neutrons, and electrons. It also discusses isotopes, atomic mass, atomic number, and average atomic mass.
Chemistry - Basic Introduction:
https://www.youtube.com/watch?v=-KfG8kH-r3Y
Significant Figures Review:
https://www.youtube.com/watch?v=l2yuDvwYq5g
Unit Conversion Problems:
https://www.youtube.com/watch?v=eK8gXP3pImU
Pure Substances & Mixtures:
https://www.youtube.com/watch?v=OHhnm2p5G3o
Physical and Chemical Changes:
https://www.youtube.com/watch?v=YE2xaMsoGFU
_________________________________
Atoms - Basic Introduction:
https://www.youtube.com/watch?v=acdkMeEKCNQ
Cations and Anions Explained:
https://www.youtube.com/watch?v=aAV2DMAI5f8
Diatomic Elements & Molecules:
https://www.youtube.com/watch?v=gi337Mx7wTc
Elements, Atoms, & Molecules:
https://www.youtube.com/watch?v=pSJeMJaCkVU
Protons, Neutrons, & Electrons:
https://www.youtube.com/watch?v=65dDZulPhtg
__________________________________
Average Atomic Mass:
https://www.youtube.com/watch?v=JT18bDAadQ0
What Are Isotopes?
https://www.youtube.com/watch?v=bagegEZBtOs
Percent Abundance of Isotopes:
https://www.youtube.com/watch?v=w-WhwWNC8-Q
Ionic and Covalent Bonding:
https://www.youtube.com/watch?v=uDFLHTDJ4XA
Naming Molecular Compounds:
https://www.youtube.com/watch?v=3agUL7-ezXk
Writing Formulas - Ionic Compounds:
https://www.youtube.com/watch?v=GJ4Mds0CWLE
__________________________________
Final Exams and Video Playlists:
https://www.video-tutor.net/
Full-Length Videos and Worksheets:
https://www.patreon.com/MathSc....ienceTutor/collectio

This organic chemistry video tutorial provides a basic introduction into hydrocarbons. It explains the difference between aliphatic hydrocarbons and aromatic hydrocarbons as well as saturated hydrocarbons and unsaturated hydrocarbons. It covers the difference between alkanes, alkenes, alkynes, and aromatic rings such as benzene also known as an arene.
Organic Chemistry - Basic Introduction:
https://www.youtube.com/watch?v=B_ketdzJtY8
Acids and Bases - Basic Intro:
https://www.youtube.com/watch?v=owVZiKnnPME
Lewis Acids and Bases:
https://www.youtube.com/watch?v=rmaLsdFQ2KQ
Nucleophiles and Electrophiles:
https://www.youtube.com/watch?v=9QZj-F-5PV4
Constitutional Isomers:
https://www.youtube.com/watch?v=48rsf1pOhfA
_______________________________
IUPAC Nomenclature of Alkanes:
https://www.youtube.com/watch?v=TYU_JluleME
Naming Cycloalkanes:
https://www.youtube.com/watch?v=vSxZm_91GT0
Naming Bicyclic Compounds:
https://www.youtube.com/watch?v=L8wEn7sD_SA
Naming Ethers:
https://www.youtube.com/watch?v=MZbgA0w2Ts4
Naming Alcohols:
https://www.youtube.com/watch?v=kggg1dqvxX8
Naming Alkyl Halides:
https://www.youtube.com/watch?v=595ENX3iqEE
________________________________
Naming Amines:
https://www.youtube.com/watch?v=Y6AzMr0Fn3Y
Van Der Waal Forces:
https://www.youtube.com/watch?v=c3g3maYegBk
Boiling Point of Organic Compounds:
https://www.youtube.com/watch?v=Qk_uPsq10TI
Organic Chemistry PDF Worksheets:
https://www.video-tutor.net/orgo-chem.html
Organic Chemistry Exam 1 Playlist:
https://bit.ly/3kJnNXU
Full-Length Videos and Worksheets:
https://www.patreon.com/MathSc....ienceTutor/collectio
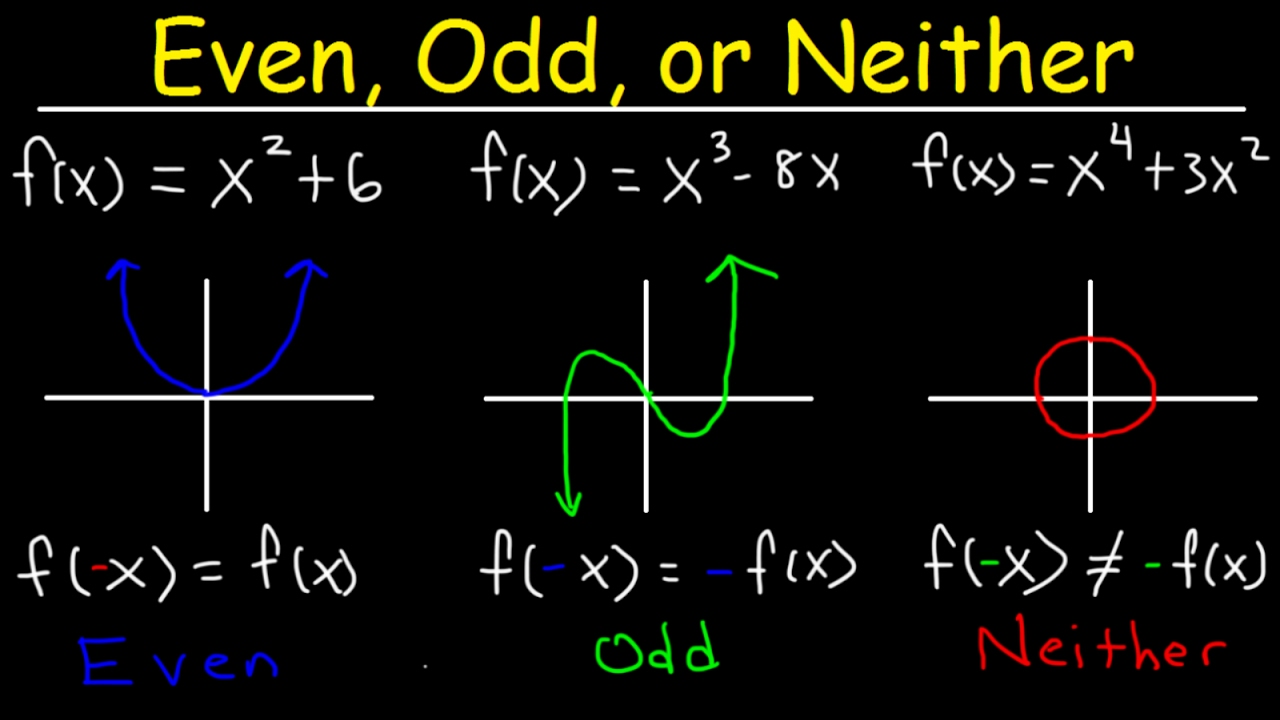
This algebra 2 and precalculus video tutorial explains how to determine whether a function f is even, odd, or neither algebraically and using graphs. This video contains plenty of examples and practice problems using variables and constants. First, plug in -x into the equation and see if the sign changes. If all signs change, it's an odd function. If they all remain the same, then it's an even function. If some change while others do not, the function is neither even or odd. For graphs, even functions are symmetric about the y axis. For odd functions, the symmetry exists about the origin. For circles with even and odd properties, it does not pass the vertical line test and is therefore not a function.
Introduction to Functions:
https://www.youtube.com/watch?v=DrEXTC6mIO8
Evaluating Functions:
https://www.youtube.com/watch?v=HyNie_PYgsY
Function Operations:
https://www.youtube.com/watch?v=3gaxVHVI4cI
Increasing and Decreasing Functions:
https://www.youtube.com/watch?v=Dyl7jPlJXOM
Relative Maximum & Minimum Values:
https://www.youtube.com/watch?v=GaltHJF6WyI
_____________________________________
Relations and Functions:
https://www.youtube.com/watch?v=wbBY2tTqXDA
Domain and Range From a Graph:
https://www.youtube.com/watch?v=KirGQOwjBVI
How To Find The Domain of a Function:
https://www.youtube.com/watch?v=djT6-YamHaA
Average Rate of Change of a Function:
https://www.youtube.com/watch?v=f_Q0qlwlclQ
The Difference Quotient of a Function:
https://www.youtube.com/watch?v=qQgVomi8lCc
_____________________________________
Evaluating Piecewise Functions:
https://www.youtube.com/watch?v=OYOXMyFKotc
Graphing Piecewise Functions:
https://www.youtube.com/watch?v=Uzw9tsGq2Pw
Composite Functions:
https://www.youtube.com/watch?v=ZFPkQkURSxk
How To Evaluate Composite Functions:
https://www.youtube.com/watch?v=6vQxIG4lJ3w
Composite Functions - Data Table:
https://www.youtube.com/watch?v=6vQxIG4lJ3w
Comp. of 3 Functions - Data Table:
https://www.youtube.com/watch?v=Ote1KvW6BXw
Decomposing Functions:
https://www.youtube.com/watch?v=NmfaC7etZms
_________________________________
Introduction to Inverse Functions:
https://www.youtube.com/watch?v=TN4ybFiuV3k
How To Find The Inverse of a Function:
https://www.youtube.com/watch?v=2zeYEx4eTdc
Verifying Inverse Functions:
https://www.youtube.com/watch?v=6QamgSPprjA
Horizontal Line Test - 1 to 1 Functions:
https://www.youtube.com/watch?v=6u9Qh1Vi_Qw
Vertical Line Test:
https://www.youtube.com/watch?v=Mxe2lX1htNk
Graphing Inverse Functions:
https://www.youtube.com/watch?v=ukEtad_aml4
Composite and Inverse Functions:
https://www.youtube.com/watch?v=GEgFmxxOJno
__________________________________
Even and Odd Functions:
https://www.youtube.com/watch?v=fKyBOLsqRlo
Transformations of Functions:
https://www.youtube.com/watch?v=Tmdrjs9xufc
Linear Functions:
https://www.youtube.com/watch?v=BtcKotD6Ni8
Functions and Graphs - Problems:
https://www.youtube.com/watch?v=kvU9sOzT2mk
Functions - Test Review:
https://www.youtube.com/watch?v=1xATmTI-YY8
______________________________________
Final Exams and Video Playlists:
https://www.video-tutor.net/
Full-Length Videos and Worksheets:
https://www.patreon.com/MathSc....ienceTutor/collectio

This organic chemistry tutorial video discusses the difference between a homolytic bond cleavage and a heterolytic bond cleavage.
Organic Chemistry - Basic Introduction: https://www.youtube.com/watch?v=B_ketdzJtY8
Acids and Bases - Basic Intro:
https://www.youtube.com/watch?v=owVZiKnnPME
Resonance Structures:
https://www.youtube.com/watch?v=OqsOIp5UuME
IUPAC Nomenclature of Alkanes:
https://www.youtube.com/watch?v=TYU_JluleME
Van Der Waal Forces:
https://www.youtube.com/watch?v=c3g3maYegBk
_______________________________
Boiling Point of Organic Compounds:
https://www.youtube.com/watch?v=Qk_uPsq10TI
Boiling Point - Test Question:
https://www.youtube.com/watch?v=KsCAY_66jsY
Melting Points of Alkanes:
https://www.youtube.com/watch?v=WXFzlDBV_kY
Physical Properties of Alkanes:
https://www.youtube.com/watch?v=F2x8wMWPpec
Water Solubility of Vitamins:
https://www.youtube.com/watch?v=BOady1INhxo
_______________________________
Newman Projections:
https://www.youtube.com/watch?v=_CCHTptAhLQ
Organic Chemistry PDF Worksheets:
https://www.video-tutor.net/orgo-chem.html
Organic Chemistry Exam 1 Playlist:
https://bit.ly/3kJnNXU
Full-Length Videos and Worksheets:
https://www.patreon.com/MathSc....ienceTutor/collectio
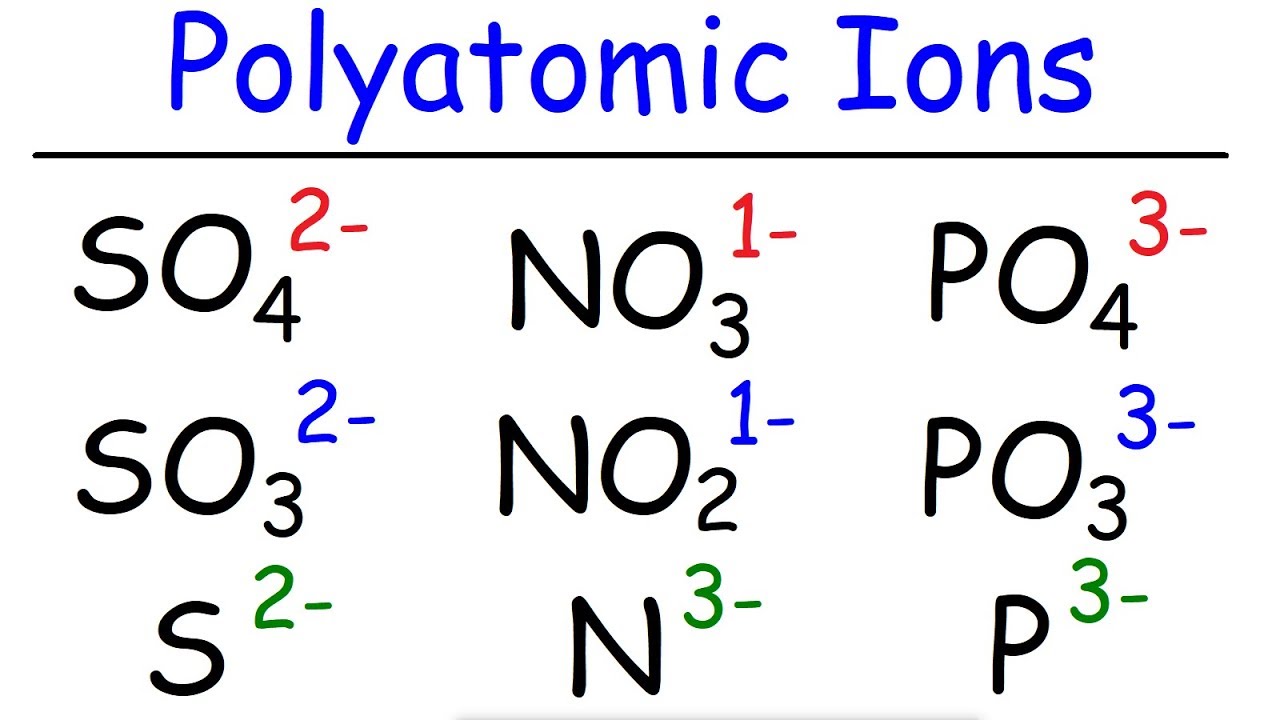
This chemistry video tutorial explains how to memorize the polyatomic ions. It provides the name of the common polyatomic ions, the charges and their respective formulas as well. Common polyatomic ions include sulfate, nitrate, acetate, ammonium, hydroxide, sulfite, cyanide, phosphate, disulfide, bicarbonate, hydrogen sulfate, bisulfite, chromate, dichromate, pyrophosphate, permanganate, thiosulfate, peroxide, superoxide, oxalate, borate, iodate, perchlorate, hypochlorite, bromite, and nitrite just to name a few. This video contains plenty of examples and practice problems including a quiz that tests you to see if you remember the common polyatomic ions.
Chemistry - Basic Introduction:
https://www.youtube.com/watch?v=-KfG8kH-r3Y
Unit Conversion Problems:
https://www.youtube.com/watch?v=eK8gXP3pImU
Physical Vs Chemical Properties:
https://www.youtube.com/watch?v=gH1R87ahFvA
Elements, Atoms, & Molecules:
https://www.youtube.com/watch?v=pSJeMJaCkVU
Protons, Neutrons, & Electrons:
https://www.youtube.com/watch?v=65dDZulPhtg
Average Atomic Mass:
https://www.youtube.com/watch?v=JT18bDAadQ0
___________________________________
Ionic and Covalent Bonding:
https://www.youtube.com/watch?v=uDFLHTDJ4XA
Naming Molecular Compounds:
https://www.youtube.com/watch?v=3agUL7-ezXk
Memorize The Polyatomic Ions:
https://www.youtube.com/watch?v=FXBEh7nd9KQ
Writing Formulas - Molecular Compounds:
https://www.youtube.com/watch?v=KrJnnwLDY6o
Naming Ionic Compounds:
https://www.youtube.com/watch?v=5rSgduXqhhU
_____________________________________
Naming Transition Metal Compounds:
https://www.youtube.com/watch?v=eM5mDnQX0k8
Writing Formulas - Ionic Compounds:
https://www.youtube.com/watch?v=GJ4Mds0CWLE
Writing Formulas - Polyatomic Ions:
https://www.youtube.com/watch?v=stu2omPRvbs
Naming Acids In Chemistry:
https://www.youtube.com/watch?v=r7PfTMAFYgs
Introduction to Moles:
https://www.youtube.com/watch?v=EowJsC7phzw
_____________________________________
Final Exams and Video Playlists:
https://www.video-tutor.net/
Full-Length Videos and Worksheets:
https://www.patreon.com/MathSc....ienceTutor/collectio
